

Solutions for Your Business -Dashboard Examples
- Learn how businesses like yours use Smart Dashboard to drive better decision-making by reviewing our dashboard examples.
- Browse sample dashboards by industry, department, or data analytics.
- In your own data, find answers to some of your most pressing business challenges. Check out our dashboard examples below.

- Industry
- Department
- Data Analytics
From education to telecommunications, Smart Dashboard helps businesses in all industries to see the story that lives in their data. Data presented in graphical format allows you to get insights quickly.

Construction
Monitor safety data, work quality, and project statuses to keep your job site running smoothly.

Education
Track performance and enrollment metrics to ensure the long-term success of students and schools.

Energy
Extract insights about energy consumption and production to implement measures for saving energy.

Government
Analyze stats like funds, expenditures, etc., and make data-driven decisions for effective budget plans and schemes.

Healthcare
Drive hospital growth and patient satisfaction together by effectively monitoring the hospital resources use and patient experience.

Hospitality
Concentrate more about increasing hotel revenue by tracking RevPAR and ADR metrics easily.

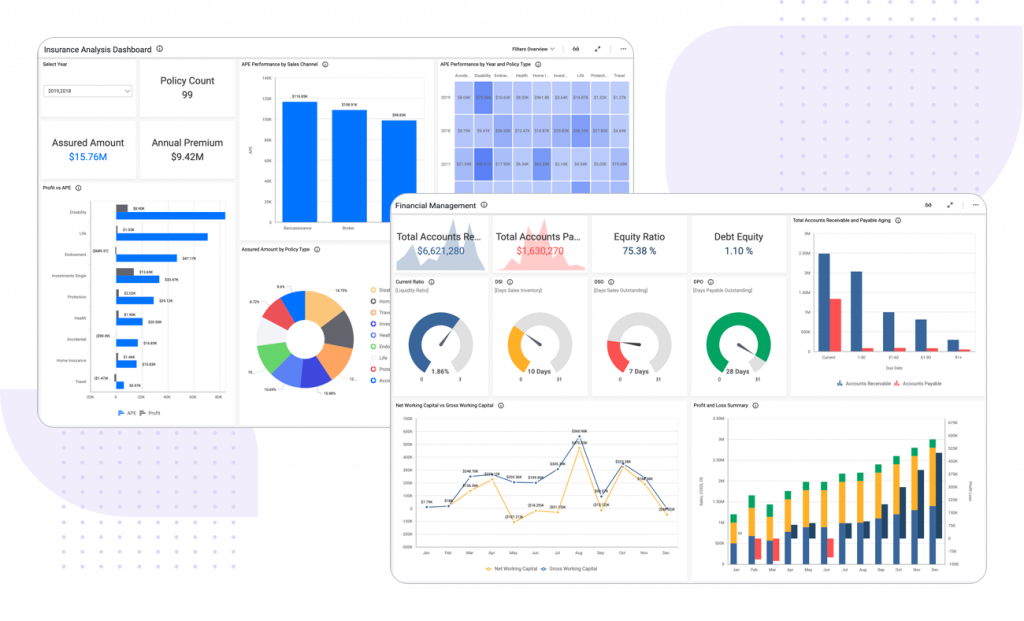
Insurance
Control risks in pricing, claims, and reserving by combining Predictive Analytics and increase the APE performance using a business intelligence dashboard.

Manufacturing
Track production metrics, equipment availability, and labor costs to increase efficiency and achieve your business goals.

Oil and Gas
Maximize upstream, midstream, and downstream operations and increase BOEPD using a business intelligence dashboard.

Pharmaceutical Analytics
Revolutionize your pharmaceutical business by tracking quality metrics in drug production like LAR and PQCR using a business intelligence dashboard.

Real Estate
Optimize your sales strategy by analyzing market data, ad campaigns, and revenue streams.

Retail
Overcome cut-throat retail competition and merchandise better by effectively tracking retail operations using a business intelligence dashboard.

Telecommunications
Increase profitability by tracking customer satisfaction metrics, network usage, and operational costs using a business intelligence dashboard.
From finance to marketing, Smart Dashboard helps all departments see the story that lives in their data. Data presented in graphical format allows you to get insights quickly.

Agile
Monitor project statuses, prioritize tasks, and ensure a positive user experience with Agile dashboards.

Finance
Present your CEO or CFO with big-picture financial metrics as an interactive business intelligence dashboard, rather than just revenue numbers.

Human Resources
Analyze people problems using data. Answer critical questions as a result of that data being presented in the most effective, clear manner using a business intelligence dashboard.

Information Technology
Concentrate on other processes by leaving IT operational analytics in service delivery, governance, and risk functioning to business intelligence tools

Marketing
Concentrate on targeted customers and increase ROI by analyzing your web marketing efforts using business intelligence tools.

Property Management
Track how your properties make money, incur expenses and understand the current state of your investment.


Make decisions and act before problems emerge. Avoid risk events and capitalize on more opportunities in your business.

Predictive Analytics
Let your past and current data be analyzed to make predictions about the future using the same business intelligence tools used for dashboarding.

Time series analysis
Forecast from the trends and relationships that appear at successive, equally spaced points in time. See what’s next using the same business intelligence tools used for dashboarding.
Schedule a 30-minute demo with our experts


