

Solutions for Sales Department
Gain financial insights from the visualization of company sales information and make decisions to increase revenue and sales. Track sales growth, average sales cycle length, and more.


If you work in sales, you need to track various data sets. On one hand, you need to monitor overall sales figures. At the same time, you need to analyze more detailed metrics such as sales by region and the average sales cycle length. This data can help you work more efficiently, develop targeted sales strategies, and review your team’s performance to adjust your approach as needed. Further, it can help ensure a positive experience for your customers.
Tracking sales metrics can help you achieve your goals and ensure your company’s long-term success. No matter your industry, KPIs can help you better understand your market, assess customers’ needs, and identify the most promising potential clients.
Whether you need to track customer acquisition costs or analyze sales growth over time, Smart Dashboard can help. Check out our sales dashboards to learn more. Then, request a demo for a complete product walkthrough.
Access live 30-minute demo with our experts
Sales Dashboard Examples

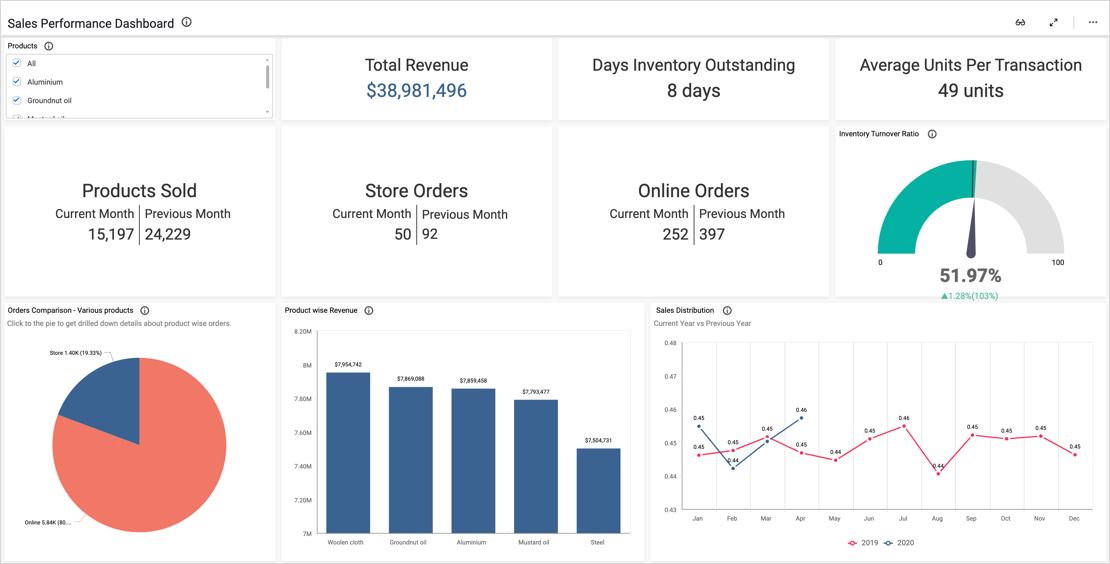
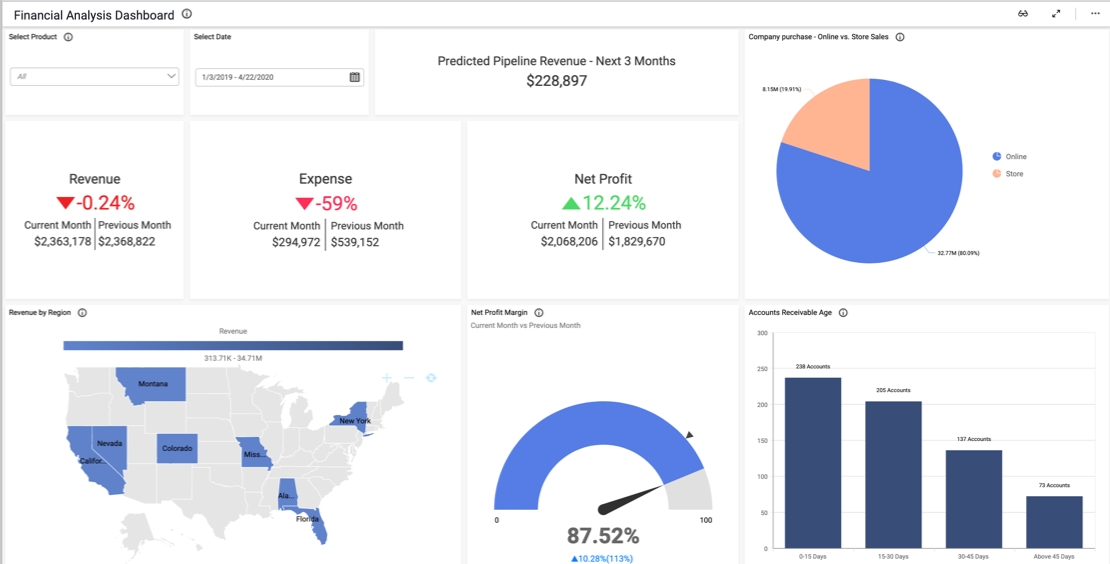
Smart Dashboard’s sales performance dashboard provides a detailed breakdown of key data sets.

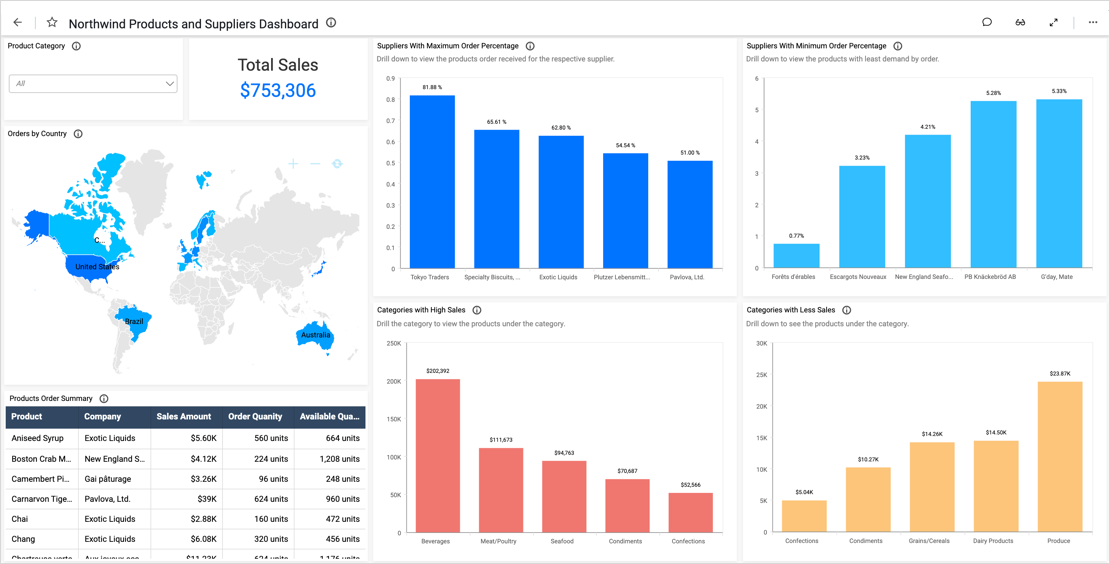
This sales dashboard lists orders placed with the fictitious supply company Northwind Traders.


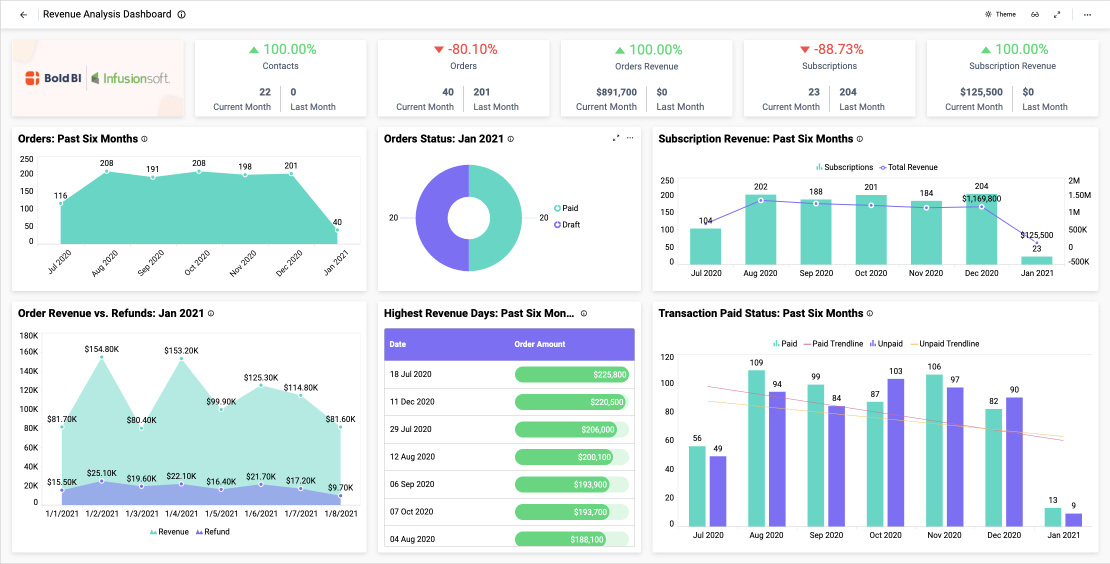
This Infusionsoft dashboard provides a detailed breakdown of a company’s recent orders.

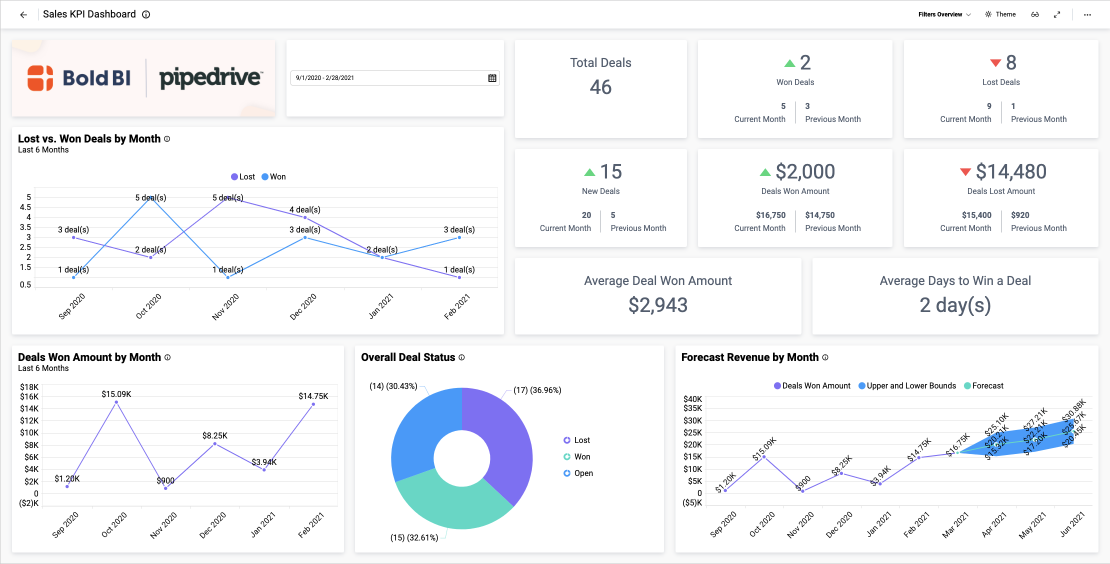
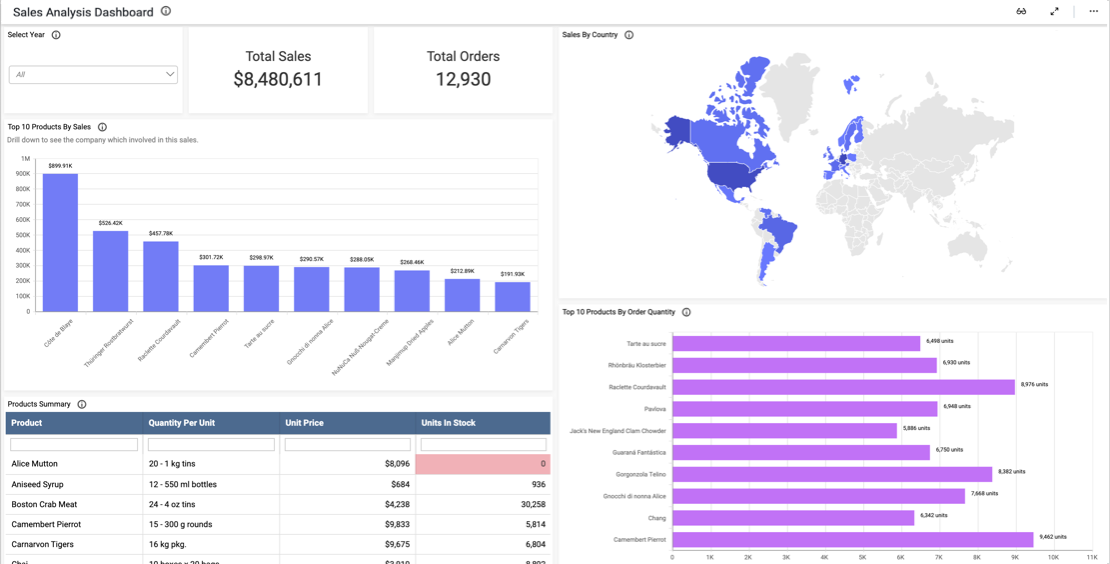
This sales KPI dashboard provides a detailed breakdown of a company’s key metrics.

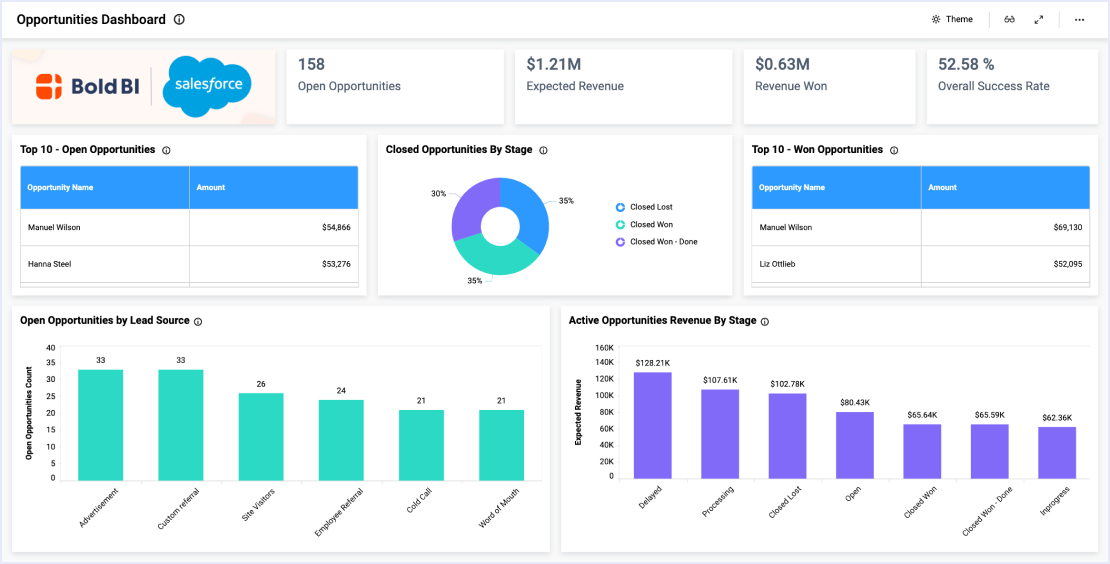
This Salesforce opportunity dashboard provides an overview of a company’s sales outlook.
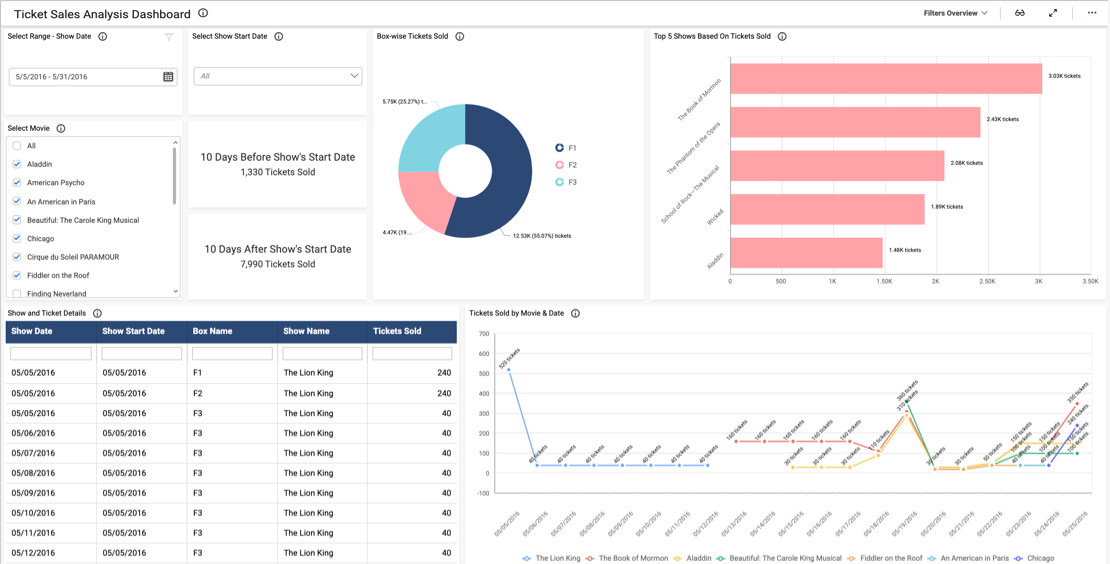
This sales activity tracker dashboard displays key data sets relating to ticket sales. With this dashboard, sales leaders can…

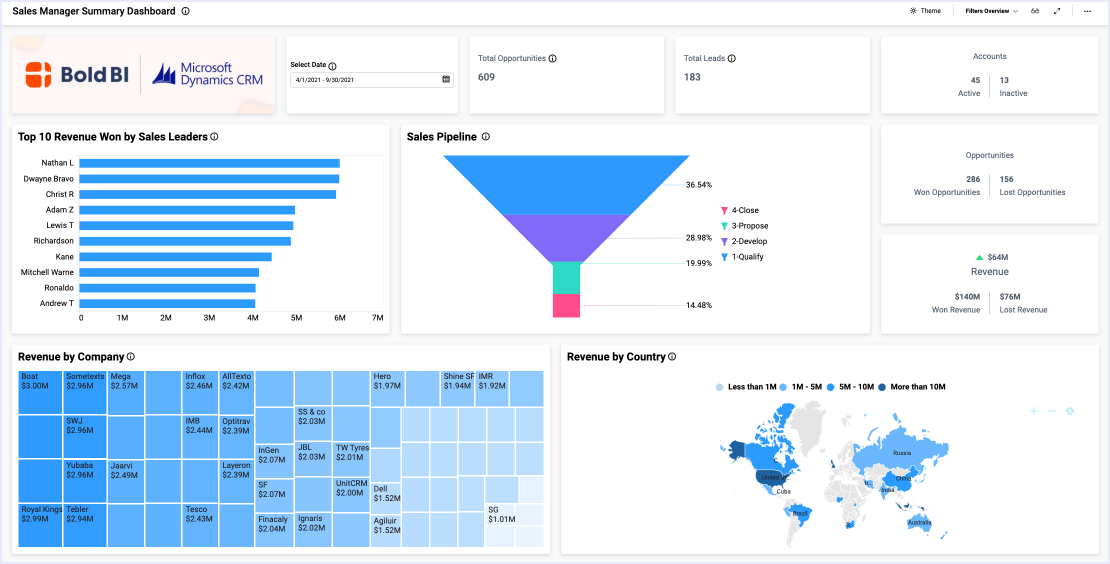
This sales manager summary dashboard provides a detailed breakdown of a company’s revenue details, leads, and sales pipeline. With this dashboard…
This sales leads tracking dashboard provides a detailed breakdown of a company’s lead and account details. With this dashboard…

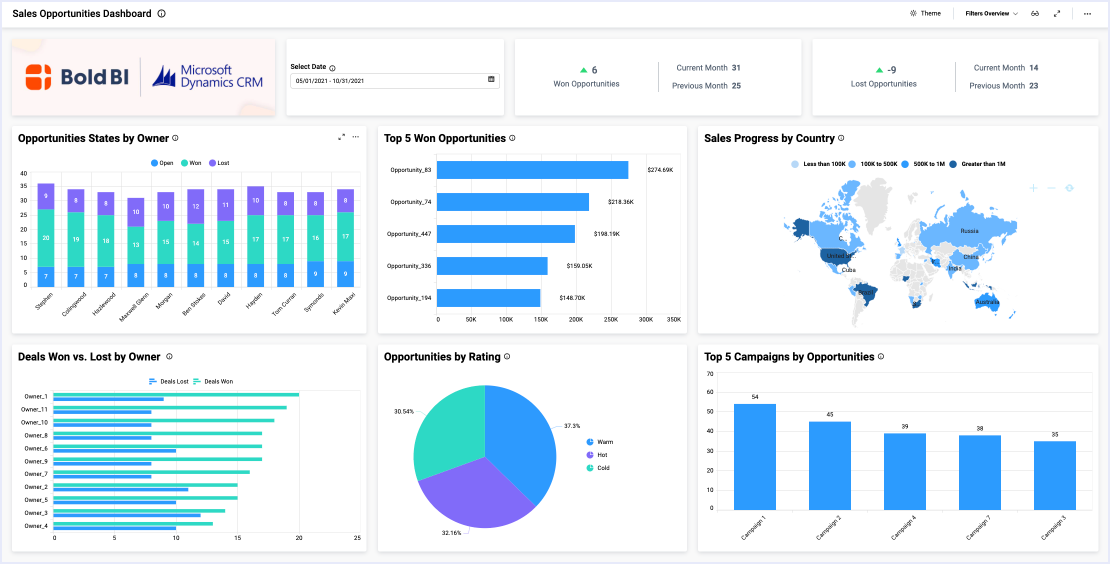
This sales opportunities dashboard provides a detailed breakdown of a company’s opportunities and revenue. With this dashboard…


This sales activities tracker dashboard provides a detailed breakdown of a sales team’s work. With this dashboard, we can answer…
Solutions for Sales – Common Metrics
With Smart Dashboard’s user-friendly, fully customizable dashboards, you can track all the key performance indicators that your team depends on:
- Total sales
- Sales per rep
- Inventory turnover
- Sales growth
- Sales by region
- Customer acquisition cost
- Average revenue per unit

