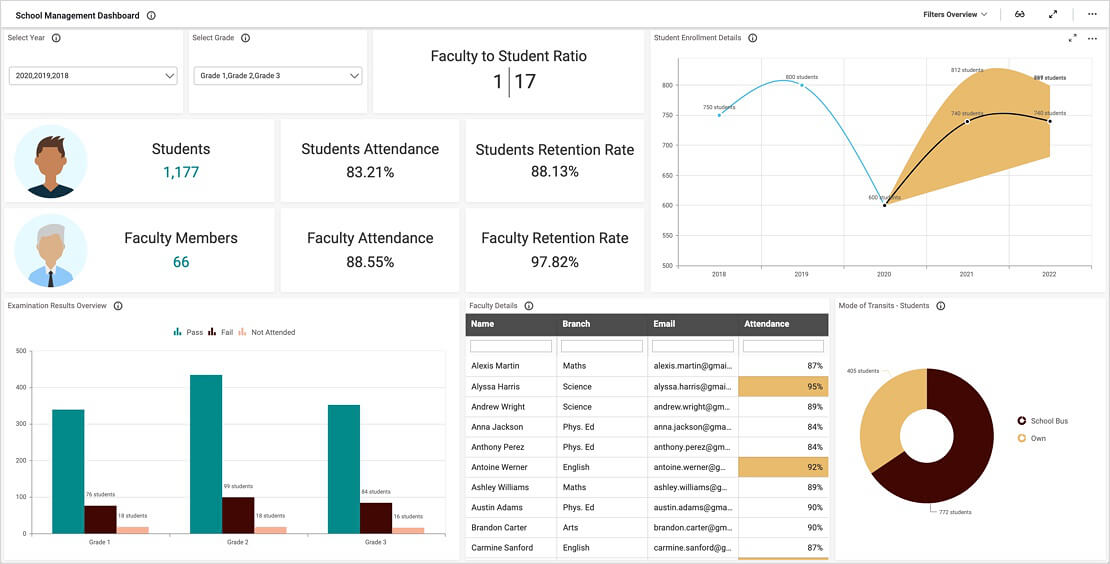
Review Students’ Attendance, Grades, Exam Results, and More
This dashboard allows viewers to track enrollment by noting the total number of students and their attendance percentages. The “Examination result by branch” column chart displays students’ exam results by subject. Also, users can track the average score for each subject.
The main screen of the “Student count by grade and gender” widget displays the total number of students by grade. However, as this pie chart uses the multi-level drill down feature, clicking a bar on the main screen will provide additional information—in this case, the numbers of male and female students by grade. The data can then be drilled down even further: clicking each slice on the grade chart will, in turn, provide the student count by gender.
Finally, the “Student details” widget can help to track student data such as name, gender, grade, GPA, average marks, and attendance percentage.
Filter Your Data
Further, one key feature of this dashboard is its versatility. By using the “Select Year” and “Select Grade” drop-down list box filters, viewers can customize the dashboard to display data for any combination of years and grades. For instance, viewers could look at the numbers for all students in grades 1–5 in 2019. Similarly, they could display only the data for third graders in 2019.
Also, users can reset the filters by clicking the funnel-shaped icons in the upper right corners of the drop-down list box widgets. If both filters are reset so that specific years and grades are not selected, we will see the overall numbers for all students for all of the years for which we have data.
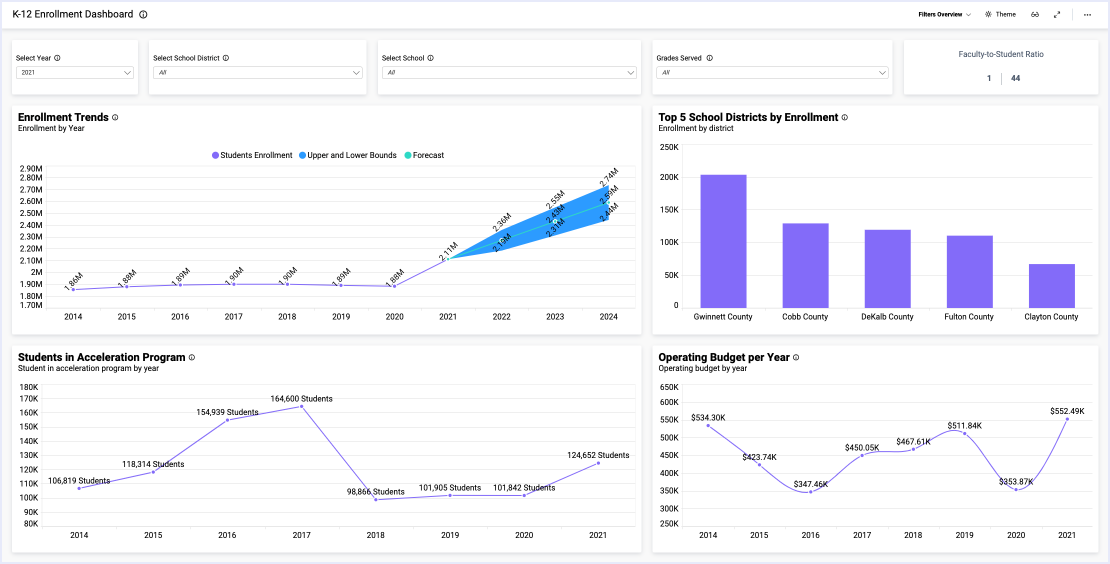
As shown above, users can apply these filters to any dashboards that display data across time periods or for separate, defined groups. As can be seen, this can be especially useful for reviewing trends over time. For example, with this dashboard, we could track enrollment, attendance, and exam results over a period of three years.