- Firstly, how many developers responded to the survey?
- Secondly, where are they located?
- Thirdly, are these developers happy with their jobs?
- Fourthly, how often do developers learn new skills?
- Finally, what are respondents’ education levels?
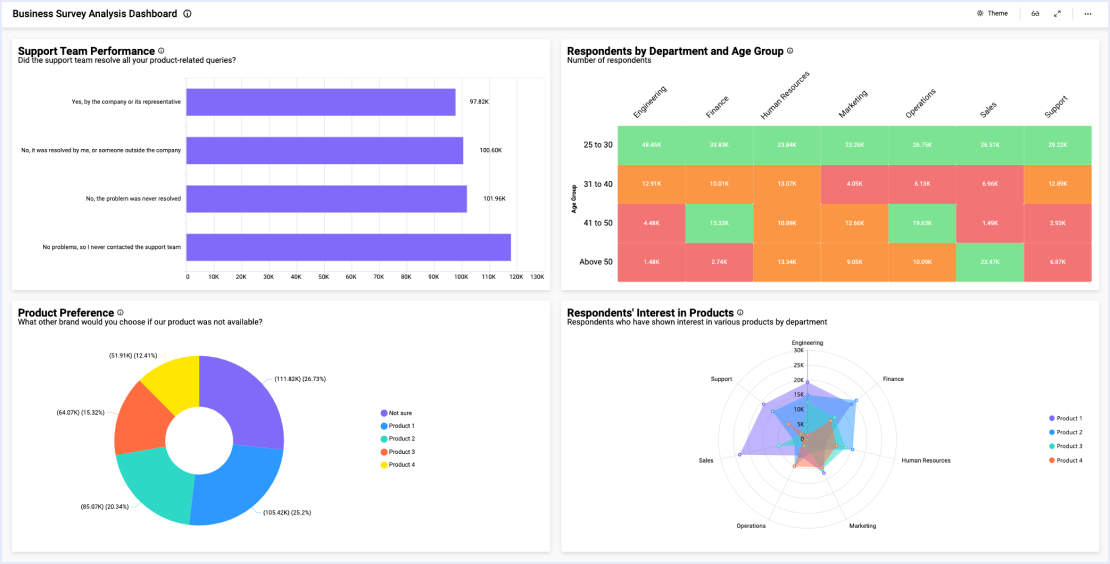
Analyze Survey Data to Gain Key Insights
This survey data analysis dashboard displays the results of a 2020 stack overflow developer survey. With this dashboard, viewers can gain insight into developers’ demographic information, job satisfaction, and interest in learning new skills. This data can help leaders develop strategies to ensure their work environments are positive and productive, which in turn helps ensure customer satisfaction.
With the card widget at the top left corner of the dashboard, viewers can see the total number of survey responses received. The dashboard also shows respondents’ locations, education levels, and job satisfaction ratings.
Then, with the bar chart at the bottom left corner of the dashboard, leaders can see how often developers are learning new languages or frameworks. Further, the DevOps Usage bar chart in the top row of the dashboard shows developers’ opinions about the importance of DevOps for software development. Finally, with the Organization Size bar chart, viewers can see the total number of employees at respondents’ companies.
Leaders can use this data to gain insight into their team members’ preferences, interests, and job satisfaction. This, in turn, can help leaders build positive and productive work environments to attract and retain top talent and thus ensure customer satisfaction.