- How much have we invested in IT operations? Conversely, how much have we billed to customers?
- How much time have we spent on each project?
- Are customers happy with our work?
- How much money goes toward running the company versus growing the company?
View Financial Data
With this IT operations data, viewers can assess the company’s overall health. For example, the “Investment” and “Billed Amount” widgets display the organization’s overall revenue and expenditures, and the “Monthly Expenses” and “2018 Revenue and Investments” widgets supply more detailed monthly breakdowns of the company’s finances. These breakdowns are especially useful for noting trends that may occur throughout the course of the year.
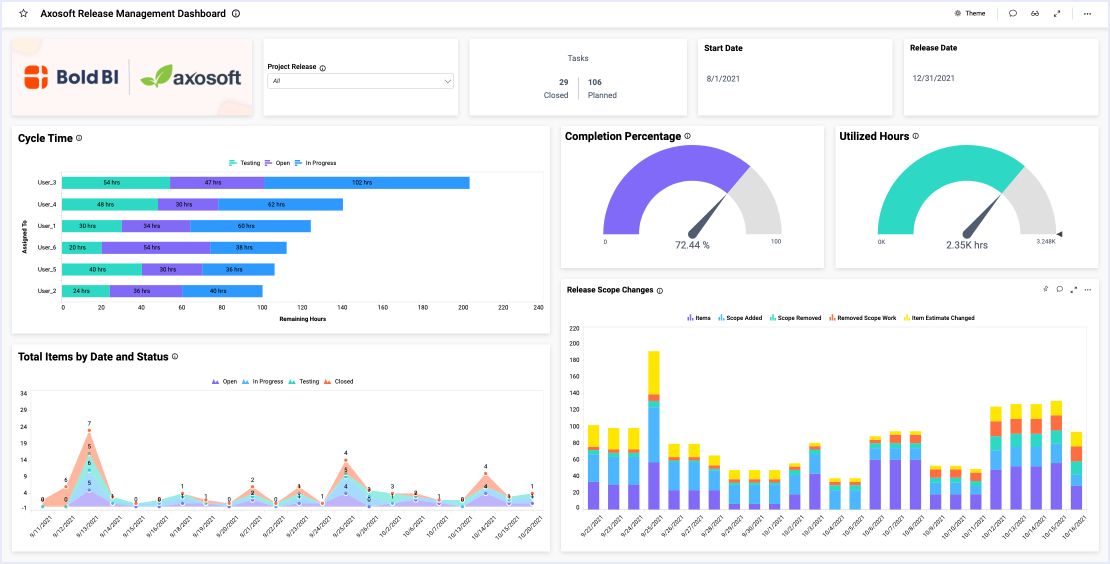
Track Your Projects
Also, the dashboard offers insight into project statuses (in terms of both the combined timeline for all projects and schedules for individual projects) and customer satisfaction. The “Completion of Project” widget provides a snapshot of whether the team is on track with all of their projects. Further, the “Total Days Spent to Complete Each Project” pie chart shows the number of days spent on each project. It also shows what percent of the team’s time has been spent on each project.
Track SLAs and Customer Feedback
Finally, the “Customer Satisfaction by Project” widget outlines which customers are pleased with the company’s work. It also shows where the company could improve. The “SLA Status by Project” bar chart supplies a more detailed breakdown. It highlights what percentages of each project are meeting customers’ SLA expectations, what percentages are at risk of not meeting customers’ expectations, and what percentages failed to meet customers’ expectations. This color-coded graph offers an easy visual reference for tracking customer satisfaction. Further, noting which projects are most successful in terms of meeting customers’ needs can help the company assess where they are excelling. Equally importantly, it can help them identify areas where they can improve.
This IT operations dashboard’s information is crucial for viewers who wish to track customer satisfaction while also analyzing the company’s efficiency and profitability.