- What is our BOEPD for the week? How does it compare to previous weeks?
- What are our top-producing wells?
- Which states are producing the most oil and gas?
- What is our total production for the past month?
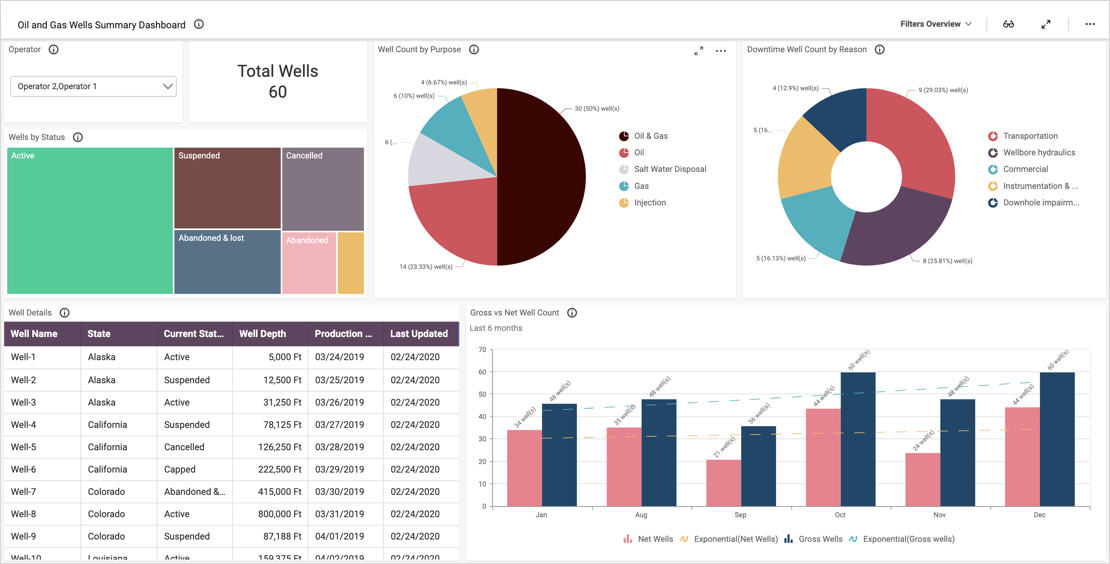
Filter Your Data
First, please note the filter in the upper left corner of the dashboard. By clicking the drop-down list box, viewers can choose to view data for either one or both operators. Then, to clear the filter and view data for both operators, viewers can click the funnel-shaped icon that appears above the drop-down list box.
Track Oil and Gas Production
With this dashboard’s widgets, viewers can track oil and gas production in a few different ways. With the Oil and Gas BOEPD widgets, we can see how many barrels have been extracted this week. We can also see how much of an increase or decrease this number is compared to the previous week.
Then, with the “Top 3” oil and gas widgets, we can see how much oil and gas the top wells have produced. We also have an easy visual reference to compare their production totals to their targets.
Next, with the “Total Production” widget, we can see which states had the most oil and gas extracted from them. This widget is a choropleth map. These maps use differences in shading to indicate differences in the values being compared. In this case, states that are a darker shade of blue produced more oil than states that are a lighter shade of blue.Smart Dashboard’s choropleth map widgets can be set up with just a few clicks of your mouse, and they are invaluable when viewers need an easy visual reference for comparing different measurements within a geographic region.
Analyze Monthly Trends
Finally, with the “Total production in last 4 weeks” widget, viewers can monitor extraction totals on a week-to-week basis. These totals are further broken down by state in the “Production by State in last 4 weeks” widget.
This dashboard’s information is crucial as it showcases the oil and gas KPIs that decision makers depend on to track both daily operations and trends that occur over longer periods of time.