- How many wells do we have? Further, what is each well’s purpose?
- What is each well’s status (active, suspended, capped, etc.)?
- How many wells are down, and why?
- How many gross and net wells do we have?
Filter Data by Operator or Well Status
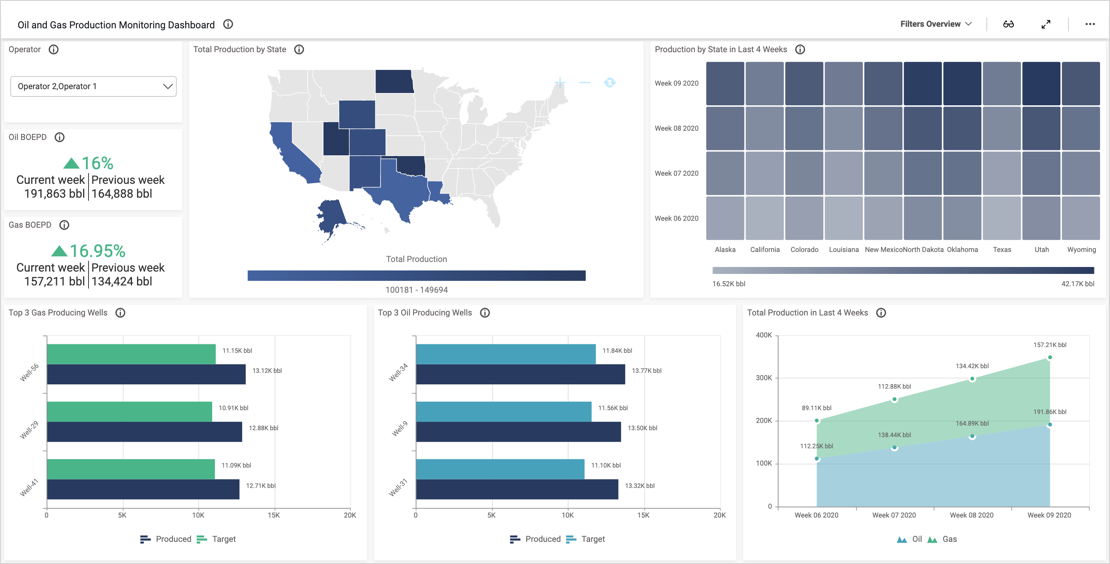
First, it is important to note that we can use the “Operator” drop-down list box in the upper left corner of the dashboard to filter data so that the dashboard only displays information for Operator 1 or Operator 2. The filter can be cleared by clicking the funnel-shaped icon in the upper right corner of the widget.
We can also filter the dashboard’s data by using the “Wells by status” tree map. Tree maps allow you to display data as clustered rectangles whose sizes represents their values. These widgets can be customized to either be monochromatic or to display a range of different colors. For example, if we had data relating to three different subjects, we could make Category A blue, Category B green, and Category C red.
In this case, we are using a monochromatic green tree map. This means that blocks that are a darker shade of green have a higher value while blocks that are a lighter shade of green have a lower value. By hovering over each rectangle, for instance, we can see that there are 28 active wells and only 2 capped wells.
However, this widget is especially useful as we can click any of its rectangles to make all of the dashboard’s other widgets display data for that particular category. For example, if I click “Cancelled,” the “Total Wells” widget’s display changes to 8. Also, the “Well count by purpose” and “Well details” widgets change their displays to only show information for cancelled well locations. Again, this filter can be reset by clicking the funnel-shaped icon in the upper right corner of the “Wells by status” tree map.
Analyze Well Types, Downtime, and More
Next, with the “Well count by purpose” widget, we can see a breakdown of the purposes of each type of well (oil and gas, oil, salt water disposal, injection, or gas).
The “Downtime Well count by reason” widget displays the reasons that wells are out of commission, along with the number of wells that currently fall into each category.
Finally, with the dashboard’s bar chart, we can see the number of gross and net wells that the company has owned over the past six months. This distinction is important as it offers a more nuanced and complete picture of the company’s size and scope than the total number of wells alone.