Google Analytics Website Traffic

Track user and session details such as bounce rate, duration, and more.

Website traffic analysis dashboard

This website traffic dashboard provides a detailed snapshot of a company’s Google Analytics data. With this data, viewers can answer the following questions: 

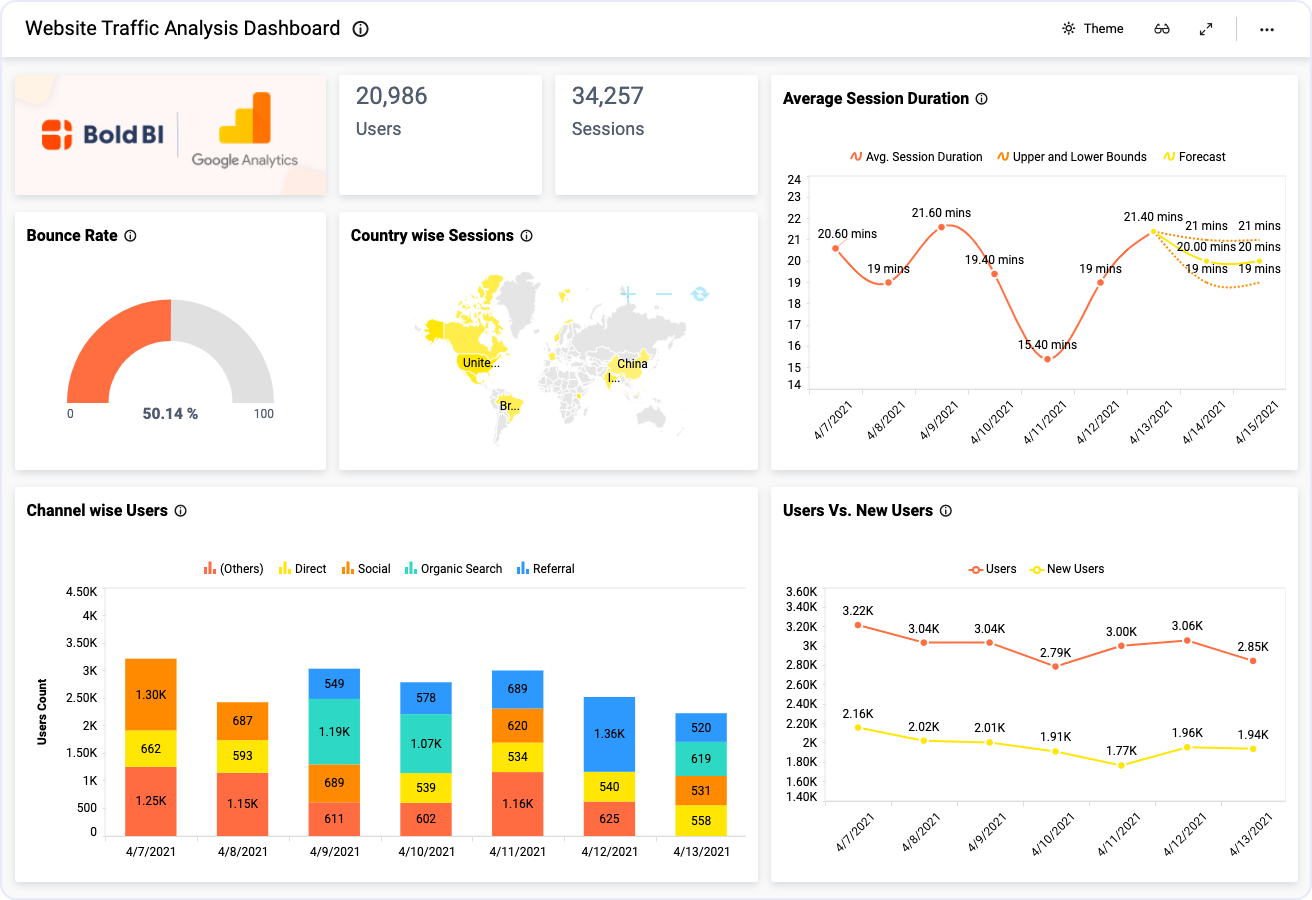
  • Firstly, how many users visited our website? 
  • Secondly, how many sessions did we have? 
  • Thirdly, how long are our sessions?
  • Fourthly, what is our bounce rate?
  • Finally, where are our users located, and how do they find us?

Analyze User Details

With the card widget at the top of the dashboard, marketing leaders can quickly see the site’s number of users. Then, on the bottom row of the dashboard, the stacked bar graph illustrates how users found the site (social media, searches, etc). With the Users vs. New Users line chart, also on the bottom row of the dashboard, leaders can view both the total number of users and the number of new users who visited the site in the past week.

Review Session Data

The Sessions card widget at the top of the dashboard clearly displays the number of sessions from the past seven days. However, leaders can glean more information from additional widgets on the dashboard.

With the Bounce Rate gauge, viewers can see the percentage of visitors who left the site without viewing other pages. The map widget beside it highlights the countries where sessions took place (users can view the number of sessions from each country by hovering over a country on the map). Finally, the Average Session Duration spline chart outlines the average length of time each visitor spent on the site. It also provides a forecast of how the numbers may trend over the next few days.

This data can offer a marketing team key insight into how users are finding the site, where they are located, and how much time they are spending on the site.


Access live 30-minute demo with our experts

Marketing Dashboard Examples

Smart Dashboard for Education

Smart Dashboard’s online marketing dashboard allows the viewer to track various pieces of crucial enrollment and performance data…

Website Analytics Dashboard
This website analytics dashboard provides a detailed snapshot of a company’s revenue-related website metrics.
Smart Dashboard for Education

This marketing campaign performance dashboard provides a detailed snapshot of a company’s ad campaign metrics. With this dashboard…


Smart Dashboard for Marketing

This ad campaign performance dashboard provides a detailed outline of a company’s ad performance metrics, revenue, and costs. With this dashboard…

Marketing Leads Dashboard

This Salesforce leads dashboard provides a detailed overview of several key metrics. With this dashboard…

Page Performance Dashboard

This Google analytics performance dashboard allows marketing teams to analyze web page performance.

Email Marketing Dashboard

This email marketing dashboard provides a detailed overview of a company’s email metrics.

Email Campaign Performance Dashboard

This marketing campaign performance dashboard highlights a company’s key email metrics. With this dashboard…

Youtube Channel Performance Dashboard

This marketing dashboard provides a detailed overview of a company’s YouTube viewer metrics. With this dashboard…

In the education field, you need to be able to monitor everything from…

In the energy industry, you need to be able to monitor everything from…

From analyzing Accounts Receivable and Accounts Payable reports to…

We'll help you find the best solution for you

Up arrow icon
Live Chat Icon For mobile
Hugo Morris

Chat with the Smart Dashboard Sales team now!

Live Chat Icon