Website Analytics

Track website visitors, sales channels, recurring revenue, and more.

Smart Dashboard Website Analytics Dashboard

This website analytics dashboard provides a detailed snapshot of a company’s revenue-related website metrics. With this dashboard, viewers can answer the following questions:

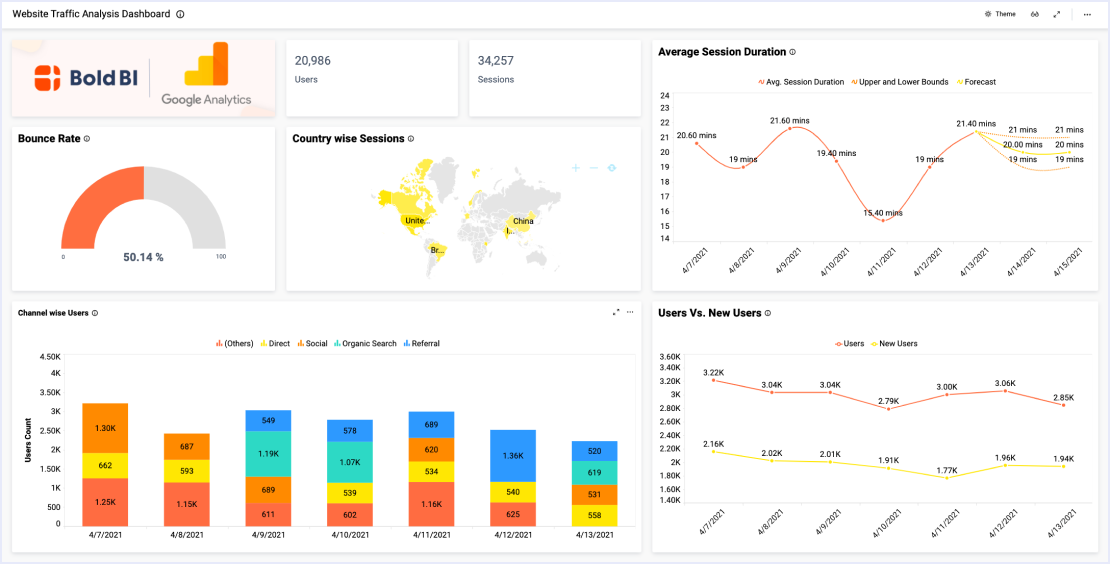
  • Firstly, how many customers are visiting our website?
  • Secondly, how many leads do we have?
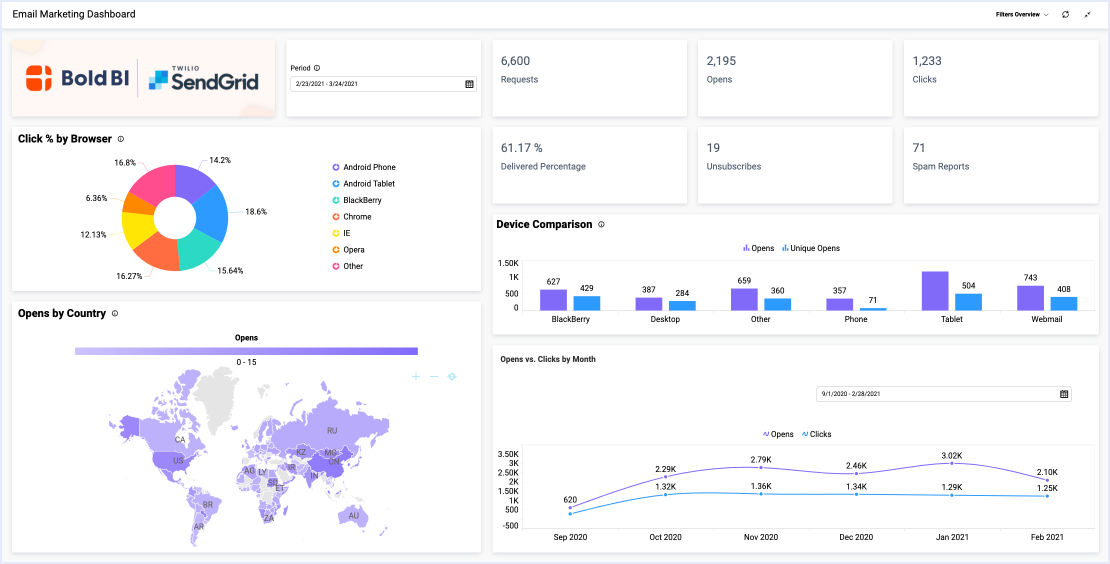
  • Which channels are bringing in our sales?
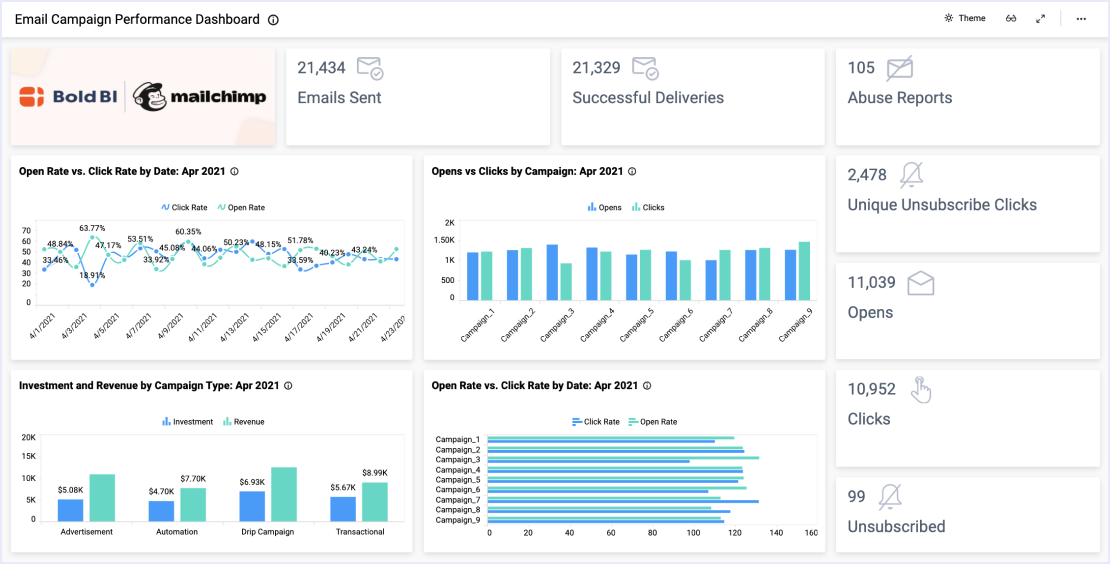
  • How much recurring revenue do we have?
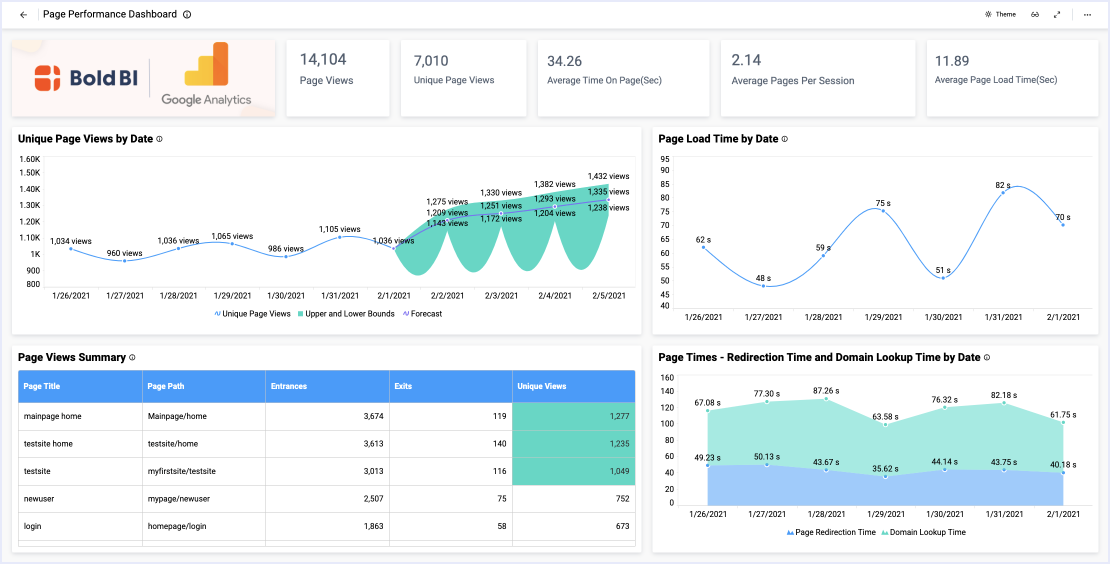
  • Finally, which web pages drive the most sales?
 

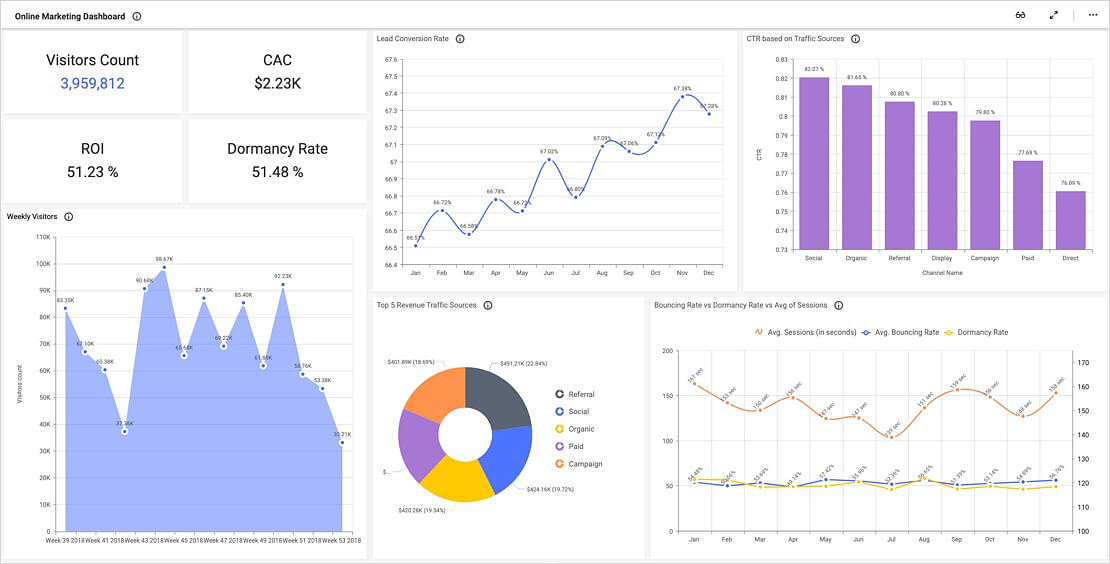
Review Website Visitor Metrics


Firstly, the card widgets on the left side of the dashboard display the number of visitors, leads, qualified leads, and customers the website has produced. Further, the bounce rate gauge displays the percentage of visitors who leave the site without viewing additional pages. 

This data provides a helpful overview of website visitors’ behavior and could offer insight into the effectiveness of the company’s marketing and web design efforts.


Analyze Revenue-Related KPIs


With the gross volume by channel doughnut chart, leaders can review the company’s sales sources. This data could help illustrate the success of advertising initiatives, as well as areas where the company might improve. Similarly, the Top 5 Landing Pages bar chart displays the web pages that drive the most revenue. With this information, marketing and sales teams can analyze what kinds of resources customers value and what will ultimately prompt them to make a purchase.

Meanwhile, several widgets offer insight into the company’s overall sales performance. For example, recurring revenue, or predictable revenue, allows leaders to identify trends that may occur over time. Similarly, the average revenue per customer and lifetime value metrics forecast how much income the company can expect to earn. These KPIs are especially useful for leaders who want to monitor the company’s long-term sales performance.

This dashboard’s information is critical because it displays an easy visual reference for both website and financial analytics. With this data, users can quickly assess the results of marketing and sales initiatives and then determine whether any adjustments need to be made.


Access live 30-minute demo with our experts

Marketing Dashboard Examples

Smart Dashboard for Education

Smart Dashboard’s online marketing dashboard allows the viewer to track various pieces of crucial enrollment and performance data…

Smart Dashboard for Education

This marketing campaign performance dashboard provides a detailed snapshot of a company’s ad campaign metrics. With this dashboard…


Smart Dashboard for Marketing

This ad campaign performance dashboard provides a detailed outline of a company’s ad performance metrics, revenue, and costs. With this dashboard…

Marketing Leads Dashboard

This Salesforce leads dashboard provides a detailed overview of several key metrics. With this dashboard…

Page Performance Dashboard

This Google analytics performance dashboard allows marketing teams to analyze web page performance.

Email Marketing Dashboard

This email marketing dashboard provides a detailed overview of a company’s email metrics.

Google Analytics Website Traffic Dashboard

This Google analytics website traffic dashboard provides a detailed snapshot of a company’s Google Analytics data.

Email Campaign Performance Dashboard

This marketing campaign performance dashboard highlights a company’s key email metrics. With this dashboard…

Youtube Channel Performance Dashboard

This marketing dashboard provides a detailed overview of a company’s YouTube viewer metrics. With this dashboard…

In the education field, you need to be able to monitor everything from…

In the energy industry, you need to be able to monitor everything from…

From analyzing Accounts Receivable and Accounts Payable reports to…

We'll help you find the best solution for you

Up arrow icon
Live Chat Icon For mobile
Hugo Morris

Chat with the Smart Dashboard Sales team now!

Live Chat Icon