- How many customers are visiting our website?
- What are our lead conversion and click-through rates?
- What are our top sources of revenue?
- How many customers are using our products?
- What is our marketing return on investment?
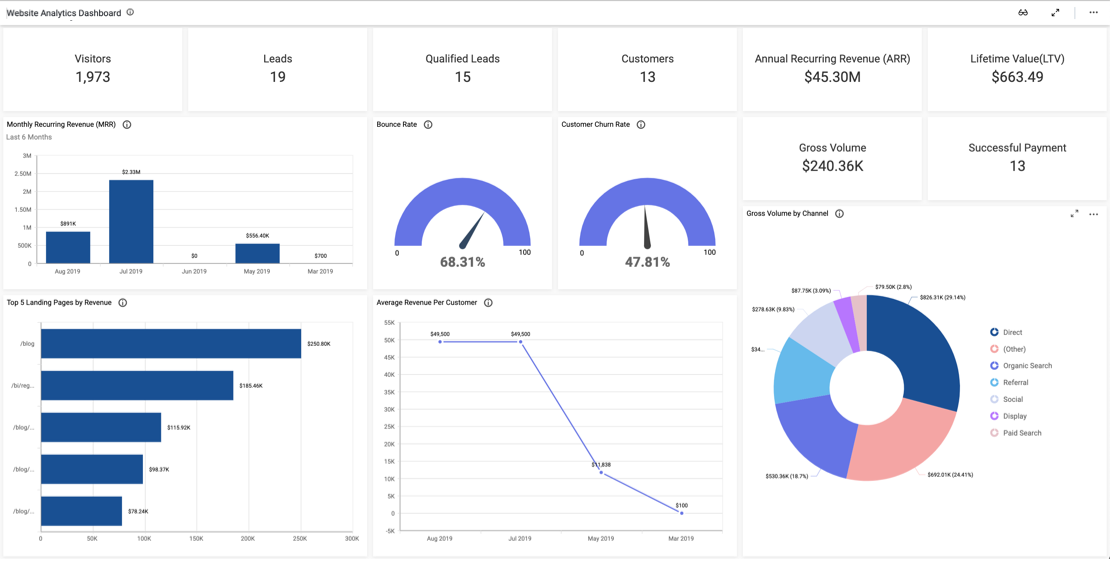
Review Website Traffic and Revenue Sources
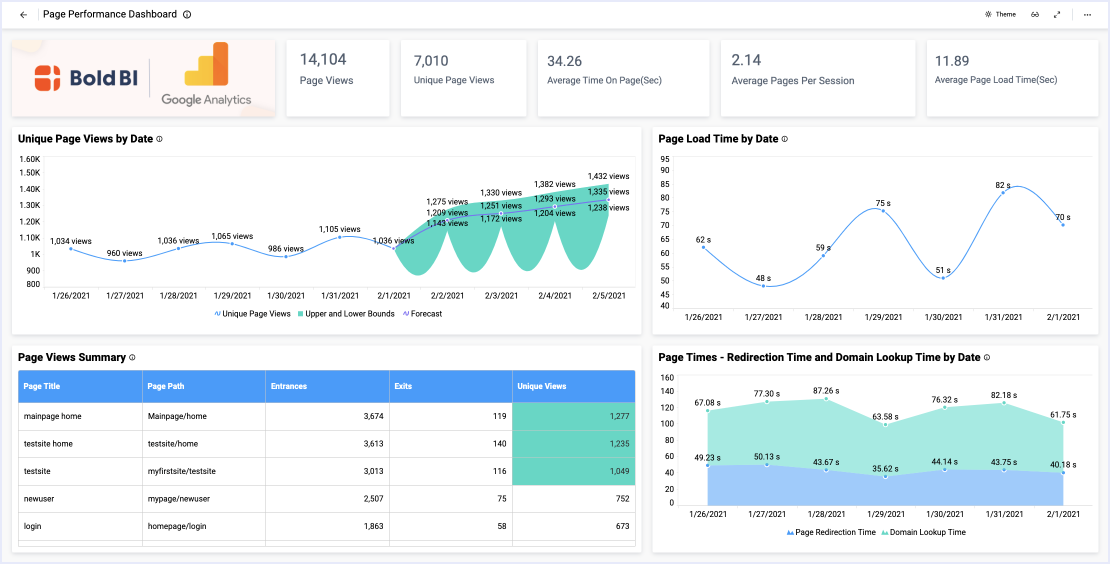
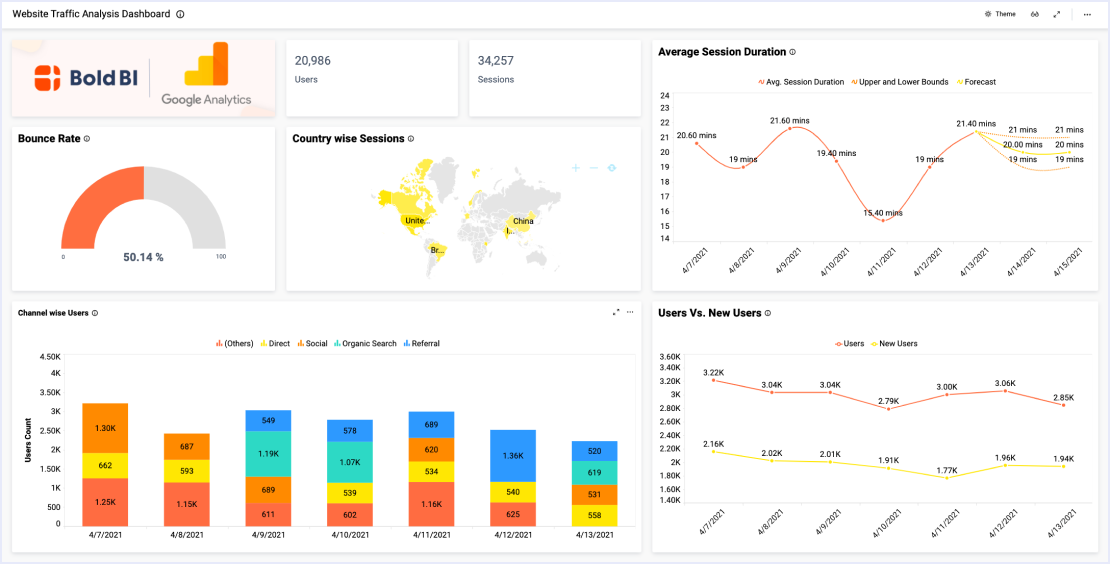
Firstly, the “Visitors Count” and “Weekly visitors” widgets outline the number of visitors to the company’s website. The weekly breakdown provided by the spline chart is especially useful. It allows viewers to review changes to website traffic that occur over time, offering a more complete picture than that expressed by the total visitor count alone. This data could help the team recognize which marketing initiatives drove the most website traffic and which were less successful.
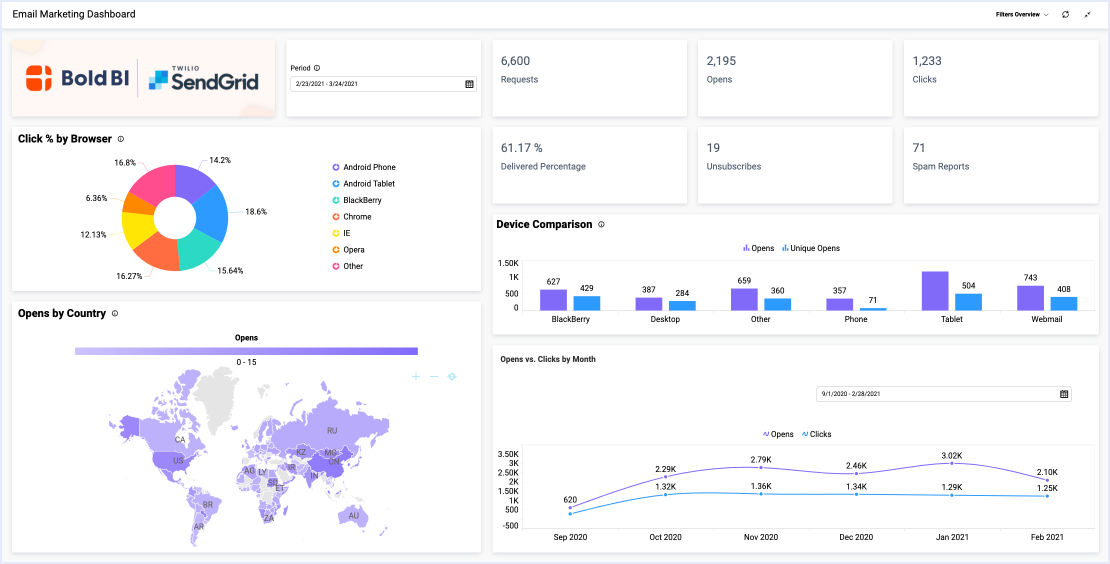
Then, the “Lead Conversion Rate,” “CTR Rate based on Traffic Sources,” and “Top 5 Revenue Traffic Sources” charts offer additional insight into the success of the team’s outreach efforts. While the “Lead Conversion Rate” widget displays percentages, the CTR chart presents a detailed breakdown based on website traffic sources . The revenue traffic sources doughnut chart outlines the percentage of revenue that resulted from each of the top five types of marketing initiatives. This information could help the marketing team determine which traffic sources are most successful and could help them allocate resources appropriately.
Analyze ROI and Customer Acquisition Costs
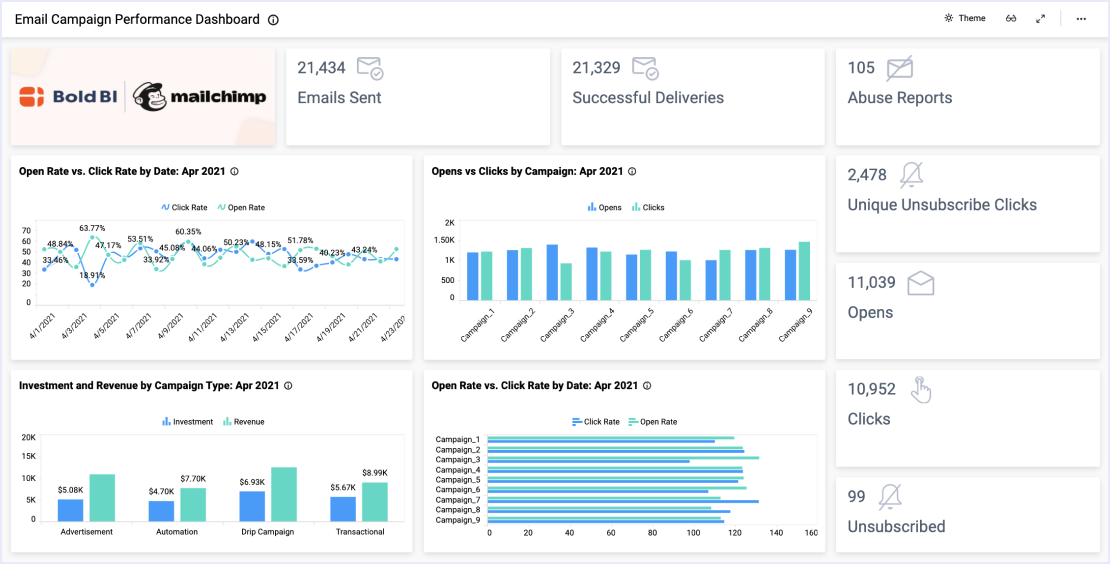
Finally, a company’s return on investment is one of its most important metrics, and this holds true for marketing teams as well. The ROI widget sheds light on the team’s impact by illustrating how much sales growth resulted from their advertising efforts. The “Dormancy Rate” and “Customer Acquisition Cost” widgets show how many customers are not actively using the company’s products and the cost of securing a new customer, respectively. Given that it is much more expensive to acquire a new customer than to retain an existing customer, and given that the company has a high dormancy rate, this data could encourage the team to reach out to reengage existing customers in hopes of keeping their business.
This dashboard’s information is critical because it displays an easy visual reference for evaluating the marketing team’s key metrics, from return on investment to lead conversion rate to website traffic sources. With these marketing KPIs, users can quickly assess various marketing initiatives and determine whether any adjustments need to be made.