- From last month to this month, what is the takt time change of a drug?
- In the LAR quality metric, what drugs rank better?
- What drugs cost more during the preclinical phase of production?
Please note the “Plant” drop-down at the top, where you can select one or more medicine-manufacturing plants and look into the KPIs related to the selected plants. The information delivered by this pharma KPI dashboard is crucial because it offers insights about two main factors that drive the production sector of the drugs industry – quality and cost.
Quality Metrics
The governing body that approves the drugs expects that quality metrics should be evaluated by all pharmaceutical firms, especially the LAR (lost acceptance rate) and PQCR (production quality complaint rate). The takt time and lead time for a drug play an important role in measuring plant and resource utilization. For each drug, “Takt Time” is showed in card widgets. This is evaluated by dividing the available production time for a drug and customers demand per day. Tracking takt time eliminates the waste of time that usually goes unnoticed. Similarly, “Lead Time,” shown in a stacked column chart, displays hours taken to complete different phases of drug production. You can also compare the total number of hours to produce a drug.
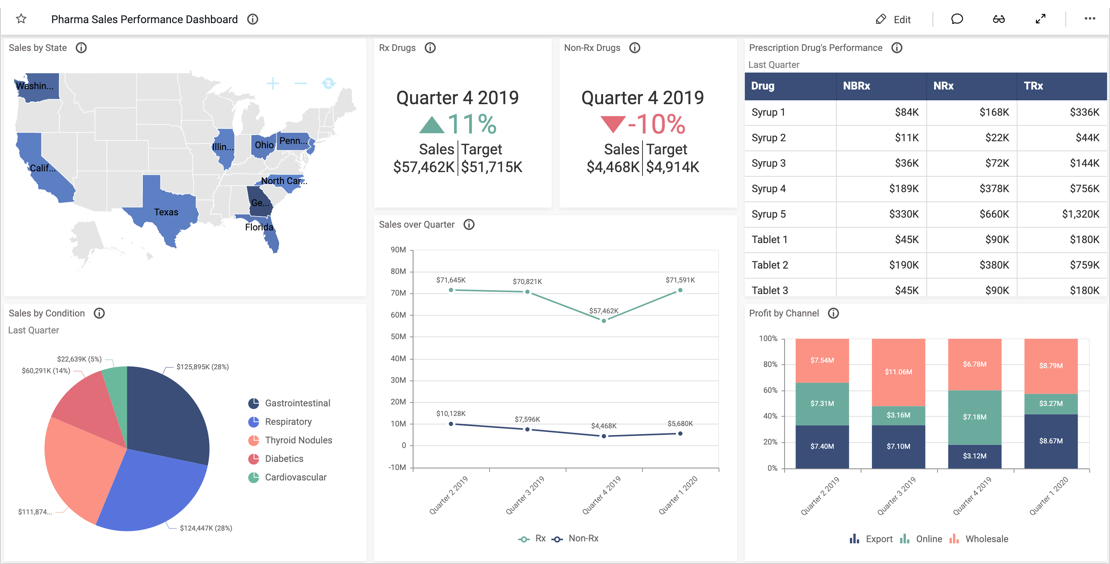
“Manufacturing Cost Summary” shows the cost incurred for each drug during development, preclinical, and clinical phases. The clinical phase is a very important phase that includes multiple tests for drugs to ensure quality before it is dispatched for sale.
Production Monitoring
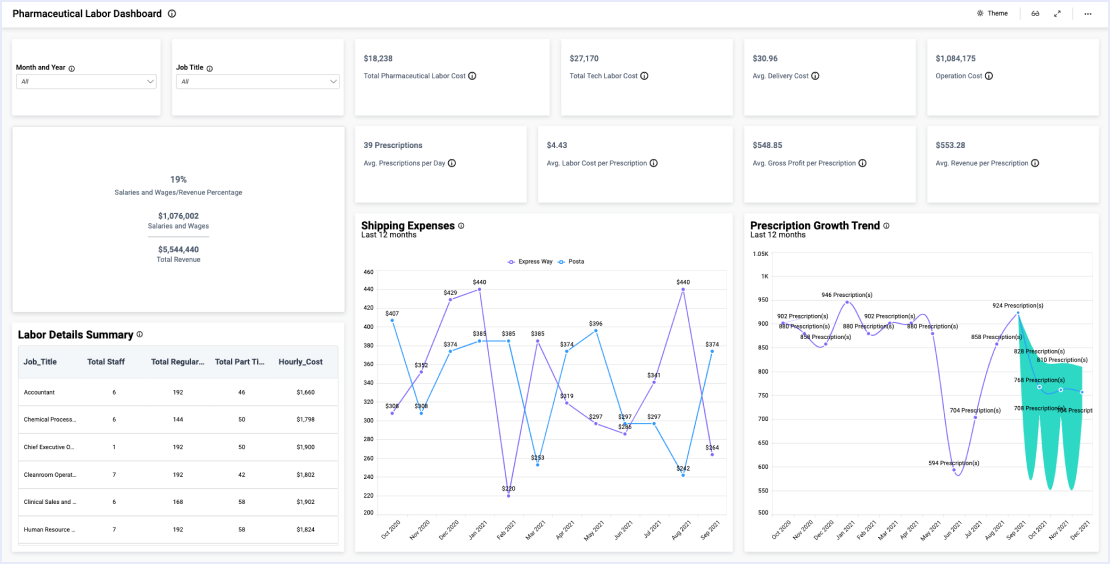
With the “Production vs Target” pivot grid, you can easily compare the produced units with the target set. The target units vary by time because manufacturing plants and machines get added or removed for various reasons. The filtering option in the pivot grid enables you to filter out quarters or drug names of your choice to limit the data displayed. Also, this pivot grid provides aggregated results like:
- From each row’s grand total, you can learn the total number of all drug units produced in a quarter of the year.
- From each column’s grand total, you can learn the number of units of a specific type of drug produced in all quarters.
Overall, pharmaceutical industries production department head will be able to track the production time, cost, units, and resources utilized and make better decisions about increasing production in the future.