- For gastrointestinal and thyroid nodule conditions, what is the sales volume of drugs?
- What are the sales of a drug in prescribed (Rx) and non-prescribed (non-Rx) forms?
- What is the percentage of change between sales and volume for Rx drugs in the state of Georgia?
Rx and non-Rx sales
Please note the United States map at the top left, where you can select a state and investigate its sales metrics. The information related to pharmaceutical sales KPIs presented in this dashboard uncovers key insights in a summarized and easy-to-understand visual, which reduces your work of analyzing multiple sales data sets provided by different pharmacies.
Drugs sales were done for both prescribed (Rx) and non-prescribed (non-Rx) drugs. Analyzing sales over target for Rx and non-Rx is crucial for the pharmaceutical companies’ sales and marketing departments. For example, Rx sales happen via prescription provided by a physician or doctor. So monitoring Rx sales values is important in tracking other areas also, like performance for sales representatives who communicate with physicians and hospitals to create brand awareness about the drugs of a company.
Prescription sales analysis
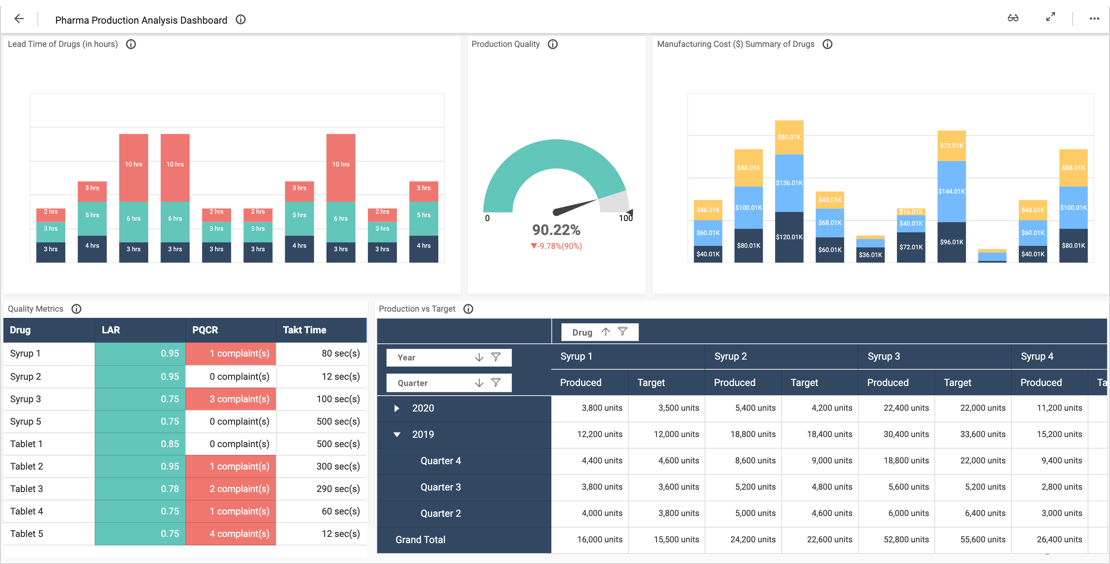
TRx (total prescriptions), NRx (total new prescriptions), and NBRx (new-to-brand prescriptions) have always been three of the most reliable metrics of brand performance. In the Prescription Drug Performance table, you can find the sales volume incurred via these three metrics for drugs of this pharmaceutical firm’s brand. Such metrics are important to track guaranteed refills and lower the risk of brand switching by consumers. In Sales by Condition, medication sales can also be tracked down by condition, such as gastrointestinal, respiratory, thyroid nodules, diabetic, and cardiovascular.
Overall, from this pharmaceutical dashboard example, pharmacists, executives, and sales representatives can drill down to glean details about medication sales by Rx or non-Rx, and by state or condition.