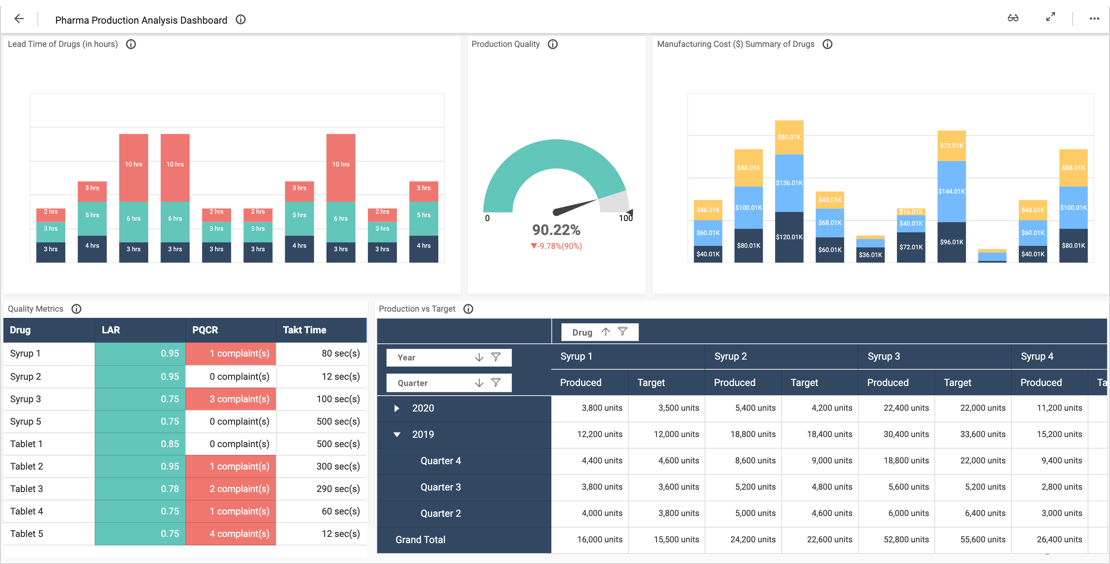
- Firstly, how much are we spending on salaries and wages?
- Secondly, what are our pharmaceutical and tech labor costs?
- Thirdly, what is our average delivery cost? Also, what do our shipping expenses look like over the past year?
- Fourthly, what is our average labor cost, gross profit, and revenue per prescription?
- Finally, how many prescriptions were filled over the past nine months, and what numbers can we project for the next three months?
Analyze Revenue and Expenses
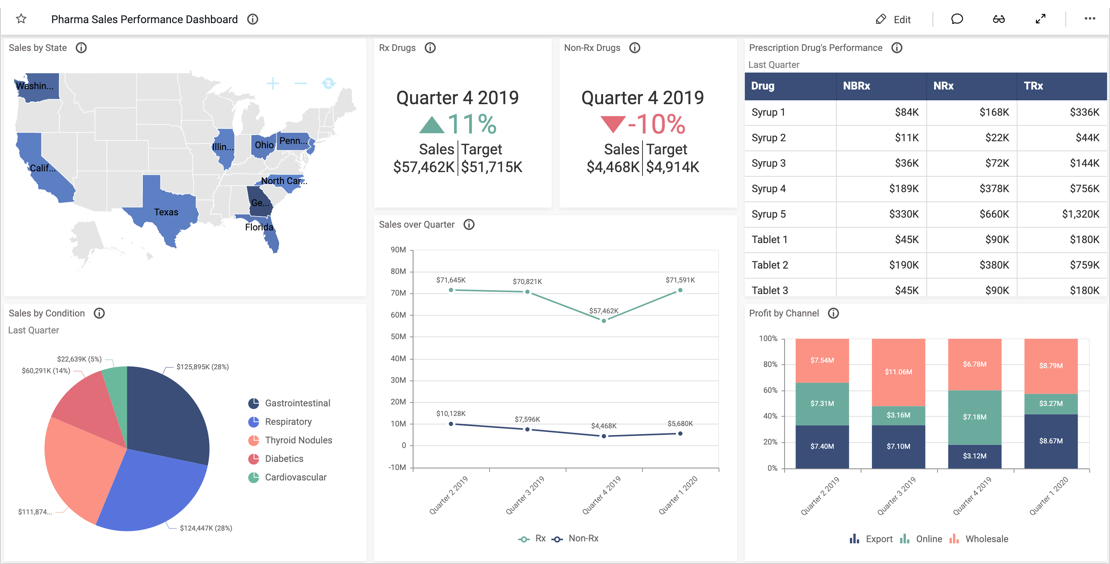
This dashboard provides an overview of crucial pharmaceutical labor KPIs. With the Salaries and Wages/Revenue Percentage widget, leaders can easily see the company’s wage costs and revenue, along with the percentage of revenue needed to cover those costs. Similarly, the card widgets along the top of the dashboard outline other costs. For example, viewers can see the pharmaceutical labor cost, tech labor cost, and operation cost. They can also see the average delivery cost and average labor cost per prescription. Further, viewers can see the average gross profit and revenue per prescription.
With the Shipping Expenses line chart, leaders can review shipping costs for the past year. Then, the Prescription Growth Trend graph shows the past nine months’ numbers, along with projected numbers for the next three months. This data can help leaders plan for the next quarter.
Finally, the Labor Details Summary grid outlines the number of staff, work hours, and pay rate for each position.
Filter Your Data
It is worth noting that viewers can filter data using the Month and Year and Job Title filters in the upper left corner of the dashboard. This feature is very useful for those who wish to review specific sets of data or focus their analysis on a set period of time.