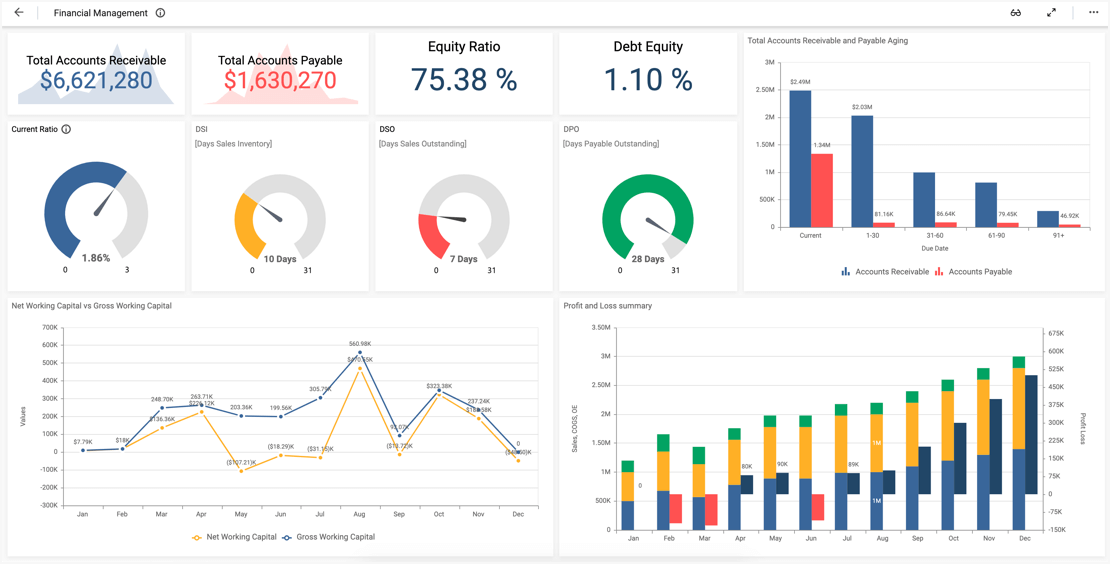
- Firstly, what are our AR and AP numbers?
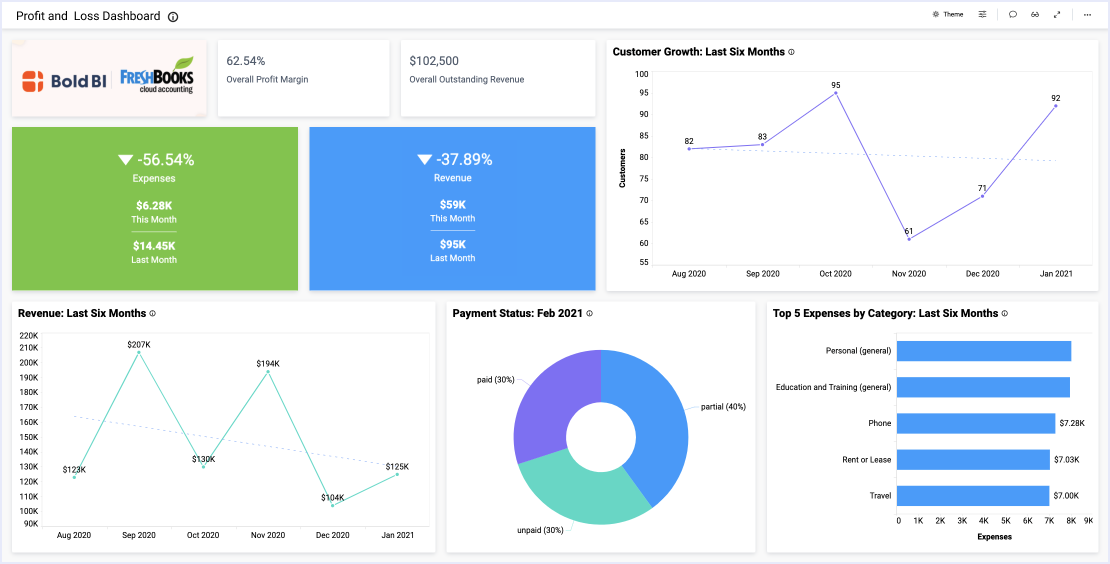
- Secondly, what are the statuses of existing invoices?
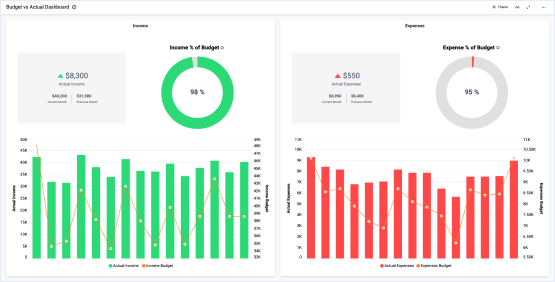
- Next, how does income compare to expenses?
- What is our profit and loss summary?
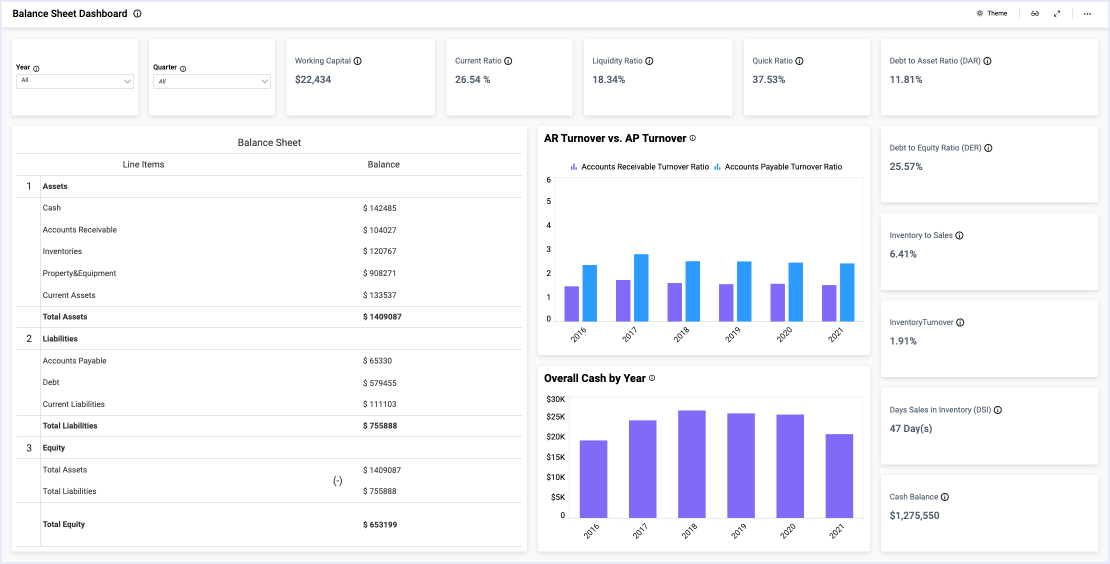
- Finally, what key metrics do leaders need to see at a glance?
Track AR, AP, and Invoice Details
Firstly, with the AR and AP card widgets at the top of the dashboard, users can see a summary of how much is owed to the company versus how much the company owes. The AR and AP line graph displays this data over a period of six months, allowing viewers to recognize trends that may occur over time, while the bar graph at the bottom of the dashboard organizes AR and AP figures by due date.
Similarly, the “Overdue Amount” and “Overdue Invoices” cards quickly show viewers how much money the company owes to others.
Finally, the two widgets focusing on invoice details—the invoice doughnut chart and grid—display invoice statuses, due dates, and amounts.
Track Key Balance Sheet Figures
This accounting dashboard also allows users to track key data sets such as income, expenses, and profits and losses. The “Income” and “Expenses” card widgets provide a quick overview of the month’s figures, but the “Expenses Breakdown” bar chart provides a detailed summary of expenses by category (advertising, rent, travel, power, etc). Further, the Profit and Loss Summary chart provides this information, along with the company’s income and cost of sales. The summary chart also displays the company’s gross and net profits.
Finally, the Executive Summary chart displays the data sets that accounting leaders depend on:
- The company’s bank balance and available cash
- Profitability metrics (costs, expenses, and income)
- Debts and assets
- Gross and net profit margins
- Return on investment
This dashboard’s information is crucial because it displays an easy, up-to-date visual reference for reviewing the complex—and constantly changing—numbers that business leaders analyze to ensure a company’s long-term financial health.