- Firstly, what are our customer and subscription numbers?
- Secondly, how many invoices are past due?
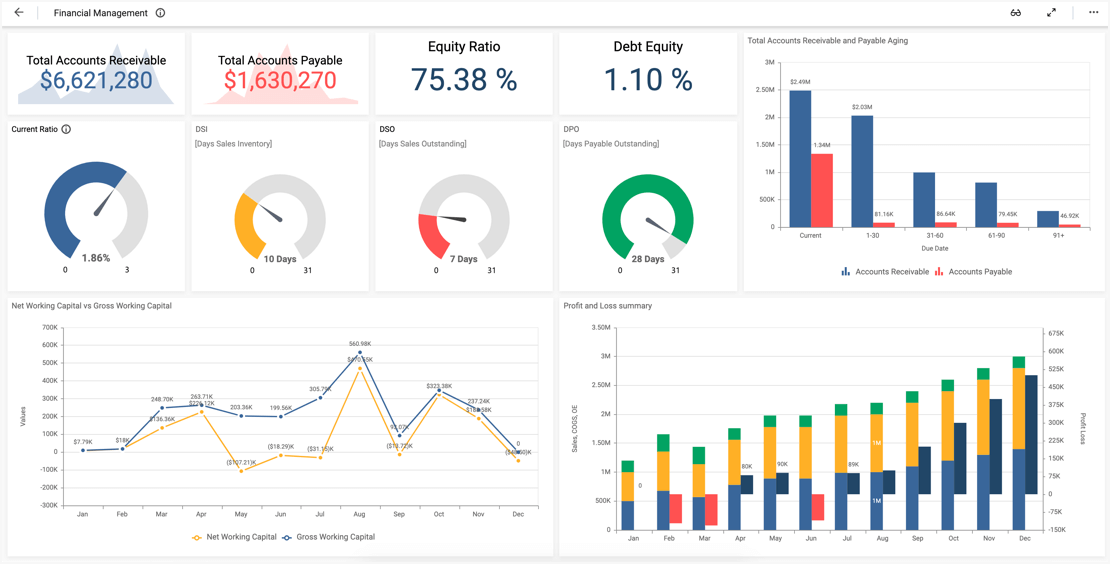
- Thirdly, what is our earned and deferred revenue?
- Fourthly, what is our average revenue per subscription?
- Finally, what are our churn and cancellation rates?
Review Subscription Details
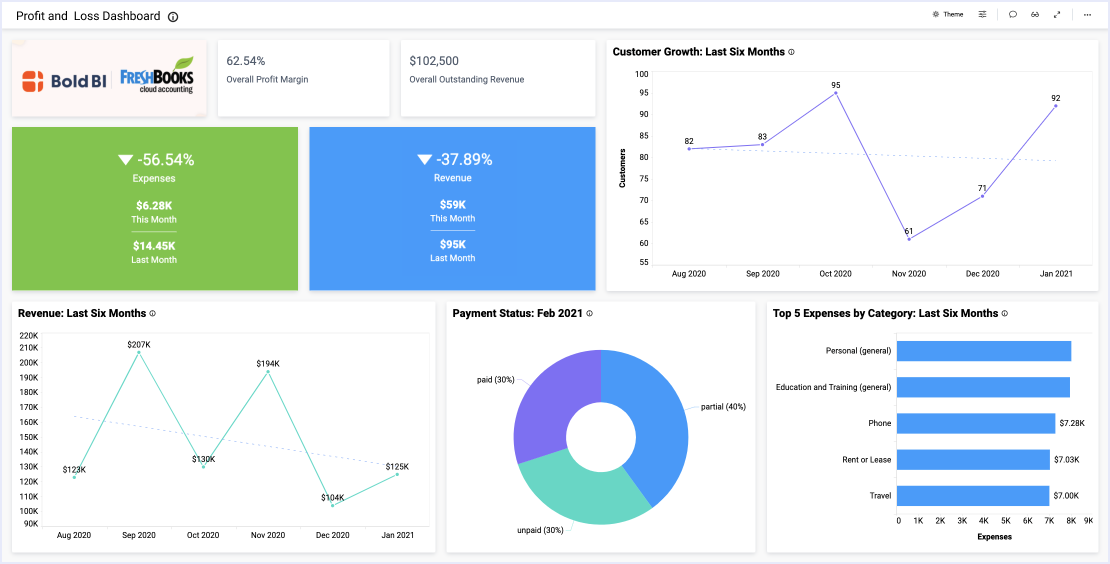
Schedule a demo today to learn how a subscription management dashboard can help your team track revenue, AR numbers, subscription details, and more. For example, with the card widgets at the top of the dashboard, leaders can see the total and active numbers of customers and subscriptions. Viewers can also see the company’s churn rate, cancellation rate, revenue by company, and the top 5 customers by revenue and by MRR.
With the Customers by Status doughnut chart, leaders can see how accounts break down by status. Similarly, the Subscription by Plan and Status bar chart details the status of each subscription, along with the plan type.
Track AR Metrics
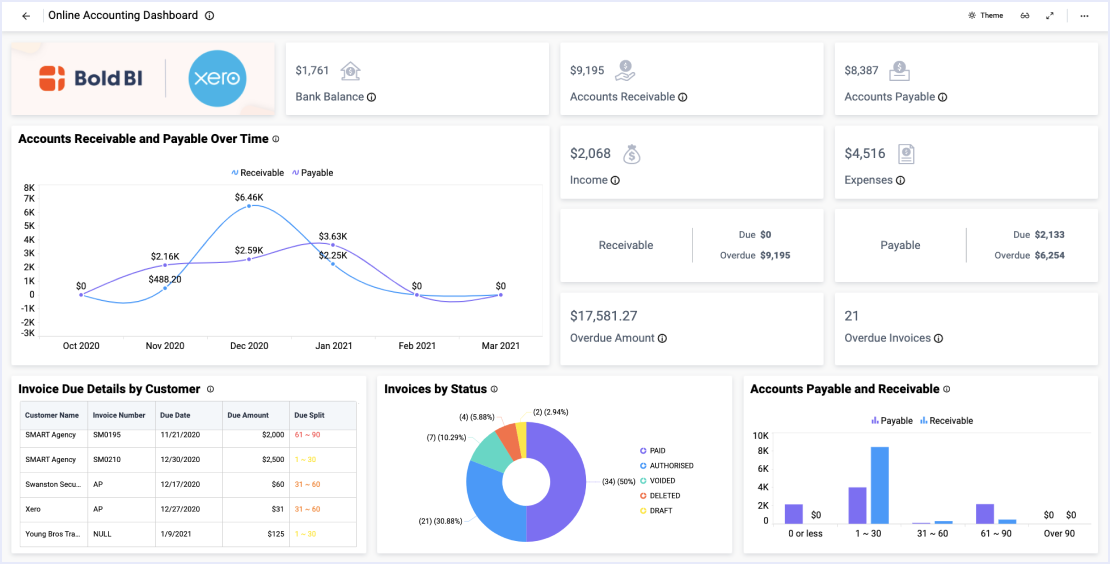
At the top of the dashboard, viewers can see the total number of invoices, along with the number of past due invoices. Then, they can see the AR balance, net collections, and earned and deferred revenue. Finally, leaders can see the average revenue per subscriber and average customer lifetime value.
With the MRR area chart, viewers can track recurring revenue trends over the past six months. Next, the AR column chart breaks down past due invoices, categorizing them by past due date. With the payment method pie chart, AR leaders can see a breakdown of customers’ payment methods.
Then, the Payment by Month area chart outlines the amount of collections and refunds for each of the past six months. The customer account status bar chart shows the number of accounts in good standing, poor standing, and collections. Finally, the Invoice Details grid shows each invoice number, customer name, amount, due date, and status.
Schedule a demo today to learn how a subscription management dashboard can help your team stay on track to meet its goals.