- Firstly, how do our assets compare to our liabilities?
- Secondly, what are our key inventory metrics?
- Thirdly, what is our AR and AP turnover, along with Days Sales Outstanding and Days Payable Outstanding?
- Finally, what do our balance sheet and overall financial statement look like?
Review Assets, Liabilities, and Inventory
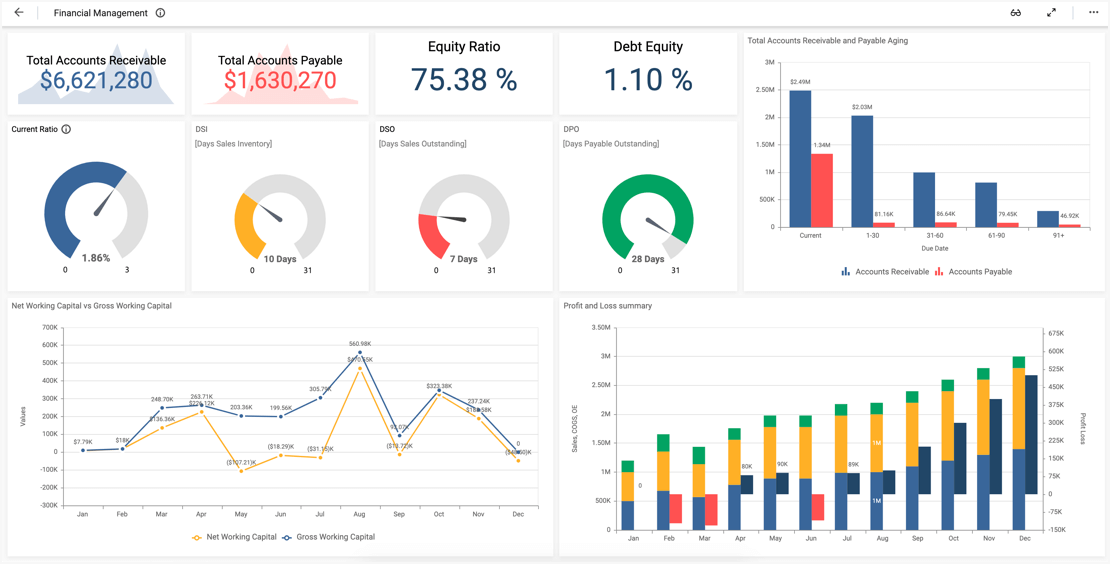
With the card widgets along the top and right side of the dashboard, viewers can quickly see the company’s working capital, current ratio, liquidity ratio, and quick ratio. Further, the Debt to Asset Ratio and Debt to Equity Ratio offer insight into the company’s financial leverage.
Other metrics, such as the inventory to sales ratio, inventory turnover, Days Sales in Inventory, and Days Inventory Outstanding, can help shed light on the company’s inventory management. Then, with the AR vs AP Turnover bar graph, Days Sales Outstanding gauge, and Days Payable Outstanding gauge, leaders can assess key sets of AR and AP data.
Assess Overall Financial Health
It is also worth noting that with the Balance Sheet in the middle of the dashboard and the Overall Financial Statement grid at the bottom of the dashboard, viewers can see a detailed overview of all the company’s key financial figures. This is invaluable for leaders who need to quickly review crucial data sets to assess the company’s overall financial health.
Finally, with the filters in the upper left corner of the dashboard, viewers can choose to see data for any combination of years and quarters. This feature is extremely useful as leaders can either focus their analysis on small, specific data sets or review several quarters or years’ worth of information, depending on their needs.